

FHFA House Price Index API — US State, Metro & National HPI
Pricing
from $33.50 / 1,000 fhfa hpi observations
FHFA House Price Index API — US State, Metro & National HPI
FHFA House Price Index (HPI) as data: purchase-only, all-transactions and expanded-data indexes for the US, census divisions, states and 400+ metro areas, monthly and quarterly from 1975. Filter by place, level and year. No API key. Part of NexGen Signal — official-source data products
Pricing
from $33.50 / 1,000 fhfa hpi observations
Rating
0.0
(0)
Developer
NexGen Signal
Maintained by CommunityActor stats
0
Bookmarked
2
Total users
1
Monthly active users
5 days ago
Last modified
Categories
Share
🏡 FHFA House Price Index API — US State, Metro & National HPI
Get the FHFA House Price Index (HPI) as clean JSON — the purchase-only, all-transactions and expanded-data indexes for the United States, the nine census divisions, all 50 states and DC, and 410 metro areas, monthly and quarterly from 1975 — straight from the Federal Housing Finance Agency's HPI master file.
Filter by place ID or name, geography level, index type, flavor, frequency and years, or ask for the latest period of every series. Values come newest period first, seasonally adjusted and not.
The unit of output is one index value: one place, index type, flavor and period. You pay per value delivered; a run that finds nothing costs nothing.
Who buys this and for what job
- Mortgage lenders, servicers and MBS investors marking collateral values and tracking house price growth by state and metro.
- Real estate investors and proptech teams comparing appreciation across metro areas and feeding valuation models.
- Economists and analysts following the US purchase-only index month by month.
- Insurers and risk teams indexing property values by region.
Buyers usually search for this as "fhfa house price index" or "fhfa hpi data".
📊 Sample Output
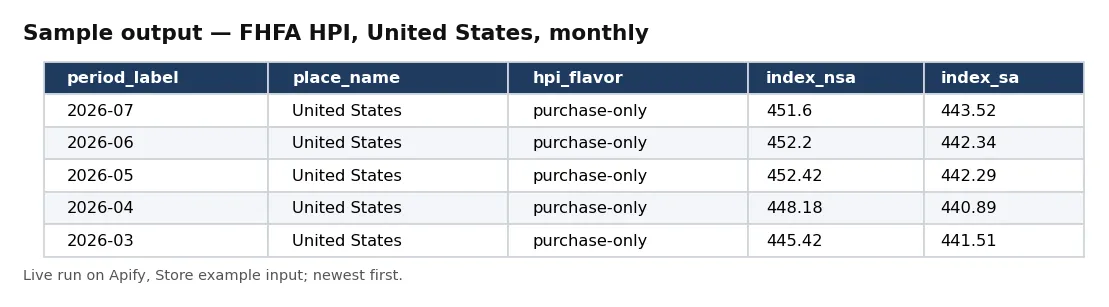
| period_label | place_name | hpi_flavor | index_nsa | index_sa |
|---|---|---|---|---|
| 2026-07 | United States | purchase-only | 451.6 | 443.52 |
| 2026-06 | United States | purchase-only | 452.2 | 442.34 |
| 2026-05 | United States | purchase-only | 452.42 | 442.29 |
| 2026-04 | United States | purchase-only | 448.18 | 440.89 |
| 2026-03 | United States | purchase-only | 445.42 | 441.51 |
| 2026-02 | United States | purchase-only | 441.02 | 440.6 |
Rows from live run ZVctZJl4uNYCFPqlw on Apify (the Store example: place USA, monthly, 10 values). Notice the newest month first and both the not seasonally adjusted and seasonally adjusted index on every row.
✅ What you get
Every field of each record:
record_id— fHFA-HPI:hpi_type— traditional, non-metro, distress-free, developmental or manufactured.hpi_flavor— purchase-only, all-transactions or expanded-data.frequency— monthly or quarterly.level— USA or Census Division, State, MSA or Puerto Rico.place_name— place name as FHFA publishes it.place_id— fHFA place ID (state code, CBSA code, DV_ division code or USA).year— year.period— month (1-12) or quarter (1-4).period_label— 2026-07 or 2026-Q2.index_nsa— index value, not seasonally adjusted (null when FHFA suppresses it).index_sa— index value, seasonally adjusted (null where FHFA publishes none).note— fHFA's note on the row, if any.source— publisher file.source_url— file URL.licence— licence notice.attribution— source line.observed_at— when this run read it (UTC).
⚙️ Sample inputs
1. The Store example — the US monthly index
Returned the 10 values above in run ZVctZJl4uNYCFPqlw (186,021 rows read, 427 matched); $0.50 on the Free plan.
2. Latest quarter for every state
Returned the latest quarter (2026-Q2) for 40 states in run 1FhX8VLbVcXn7ns7q; raise maxRecords to 51 for all states and DC.
3. One metro's history
Returned the 10 quarterly all-transactions values for the Denver metro since 2024 in run 4uxPNQdbxBY6OaeXg.
Input fields:
| Field | Meaning |
|---|---|
places | FHFA place IDs or exact place names, e.g. USA, CA (California), DV_PAC (Pacific Division), 10180 (Abilene, TX metro). Leave empty for all. |
placeNameContains | Places whose name contains any of these words, e.g. Denver, Texas. |
levels | USA or Census Division, State, MSA, Puerto Rico. Leave empty for all. |
hpiTypes | traditional, non-metro, distress-free, developmental, manufactured. |
flavors | purchase-only, all-transactions, expanded-data. |
frequencies | monthly, quarterly. |
yearFrom | First year wanted, e.g. 2020. |
yearTo | Last year wanted. |
latestOnly | One record per series (place, type, flavor, frequency): its newest period. |
order | By period. |
maxRecords | Stop after this many index values (each is charged once). |
🧾 JSON sample record
🔧 How it works
-
Robots check.
www.fhfa.gov/robots.txtis read on every run; its rules for all crawlers allow the HPI master file. A robots file that disallowed it would stop the run with nothing charged. -
One official file. The actor downloads FHFA's HPI master file (
hpi_master.csv, about 17 MB, 186,021 rows on 12 Oct 2026), which FHFA describes as appending the quarterly and monthly data. -
Filter and sort. Every row is checked against your filters; matches are sorted newest period first (a quarter counts as its last month), or one per series with
latestOnly. -
Deliver, then charge. Records are pushed in batches, each charged after delivery, so records and charges always match.
-
Receipt.
RUN_RECEIPTrecords the robots result, the file size, rows read and matched, and delivered and charged counts.
No login, API key, proxy or bot workaround.
💰 Pricing example
Per index value delivered, no start fee, no monthly charge:
| Apify plan | Price per index value |
|---|---|
| Free | $0.05 |
| Bronze | $0.045 |
| Silver | $0.04 |
| Gold, Platinum, Diamond | $0.0335 |
- 10 records (the Store example): $0.50 on the Free plan, $0.335 on Gold.
- 1,000 records (the default cap): $50 on Free, $45 on Bronze, $40 on Silver, $33.50 on Gold.
Coverage and size. United States, 9 census divisions, 50 states and DC, 410 metro areas and Puerto Rico; monthly purchase-only indexes for the US and divisions, quarterly indexes for every level; 1975 onwards for the longest series. On 12 Oct 2026 the newest monthly value was July 2026 and the newest quarter 2026-Q2. Some metro values carry FHFA notes (e.g. fewer than 1,000 repeat-sales records) and a few are suppressed (null).
⚖️ Legal & ToS
Data: Federal Housing Finance Agency, FHFA House Price Index® master file (fhfa.gov). FHFA is a U.S. federal agency; its works are not subject to copyright in the United States (17 U.S.C. §105). FHFA's datasets page, policies page and FAQs show no separate data licence. Every record carries that notice in licence and a source line in attribution. FHFA House Price Index® and FHFA HPI® are FHFA's marks; this actor is not affiliated with or endorsed by FHFA.
Area-level indexes only — no personal data. robots.txt is honoured. One public file, declared User-Agent, no login, key, proxy or form.
❓ FAQ
Do I need an FHFA account or key? No. The actor reads FHFA's public master file.
What is the difference between purchase-only and all-transactions?
Purchase-only uses repeat sales only; all-transactions also uses refinance appraisals. Expanded-data adds other sources. Filter with flavors.
Why are some metro values null?
FHFA suppresses some values when too few repeat sales exist; the note field carries FHFA's wording.
How fresh is it? As fresh as FHFA's master file; monthly values arrive with FHFA's monthly release and quarterly values with the quarterly release.
🆘 Troubleshooting
- 0 records for a place — use FHFA's place ID (e.g.
CA,USA,10180) or the exact name; metro names include the state, e.g.Abilene, TX. - Only quarterly rows — monthly indexes exist only for the US and census divisions (purchase-only).
- Mixed monthly and quarterly rows — set
frequenciesto one of them. - SOURCE UNAVAILABLE message — the source did not answer after four tries; nothing was charged — run again later.
- CAPPED message — your maximum total charge was reached; raise it in the run options.
- Run failed with "Invalid input" — a filter value is malformed; the message names the field. Nothing was charged.
🔗 Related Actors
- Europe House Prices — Eurostat House Price Index (Quarterly) — house price indexes across Europe.
- Ireland House Prices — Property Price Register Sales Search — individual Irish house sales.
- Australia Building Approvals by SA2 - ABS — new housing approvals in Australia.
- UK Construction Output Monthly - ONS — UK construction output.
- UK CPIH Inflation Time Series - ONS — UK inflation including housing costs.
🏢 About NexGen Signal — official-source data products from government and regulator publications. Browse the catalog: apify.com/nexgensignal
⭐ Found this useful?
If this actor saved you time, a rating on its Apify Store page helps other buyers find it.
Part of NexGen Signal — official-source data products.


