Actor Schema Validator — Verify Output Matches Declared Schema
Pricing
$350.00 / 1,000 schema validations
Actor Schema Validator — Verify Output Matches Declared Schema
Actor Schema Validator. Available on the Apify Store with pay-per-event pricing.
Pricing
$350.00 / 1,000 schema validations
Rating
0.0
(0)
Developer
Ryan Clinton
Maintained by CommunityActor stats
0
Bookmarked
3
Total users
0
Monthly active users
21 hours ago
Last modified
Categories
Share
Output Guard — Detect Silent Data Failures in Production
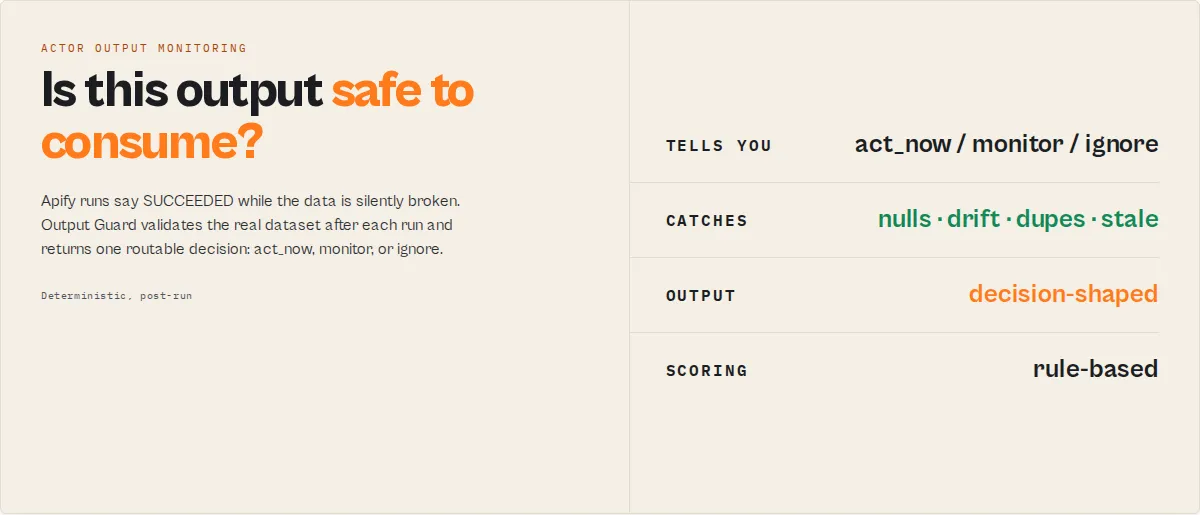
Monitor production output for silent data failures. Apify run status (SUCCEEDED) does not guarantee output correctness. Actors can return SUCCEEDED runs while producing broken or incomplete data.
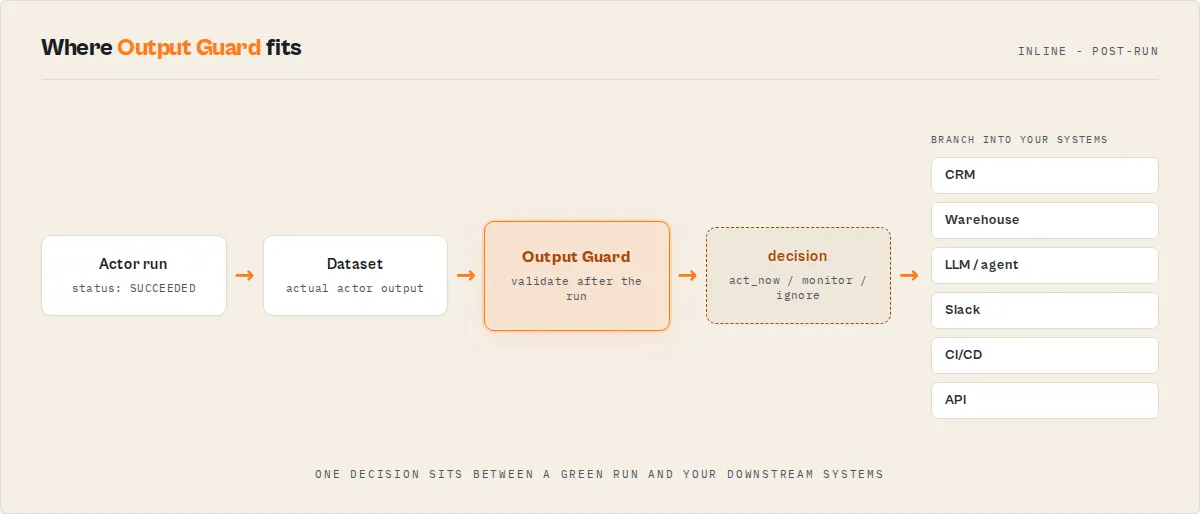
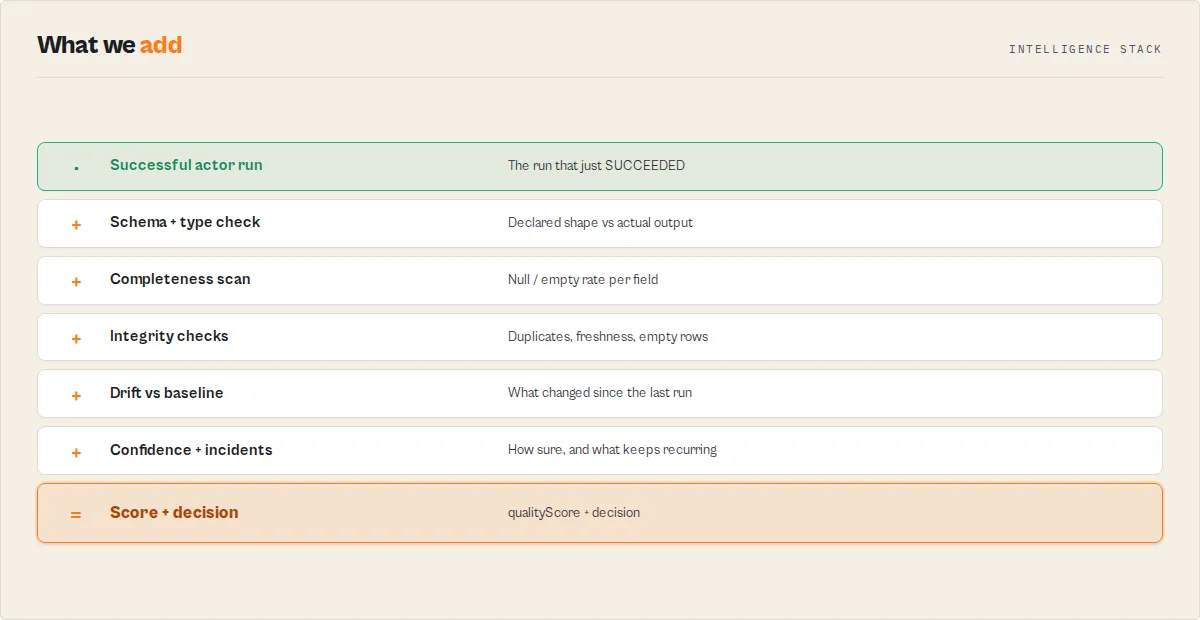
Output Guard is the post-run validation stage in an Apify actor execution lifecycle — it runs after the target actor completes and validates its dataset before the data reaches downstream systems. It sits between every actor and every downstream consumer (CRM, warehouse, LLM pipeline, dashboard, automation) and answers one question their run-status check cannot: is this output safe to consume? Each run returns a routable decision, diagnoses what changed and why, and accumulates a per-actor reliability history so the answer gets sharper every run.
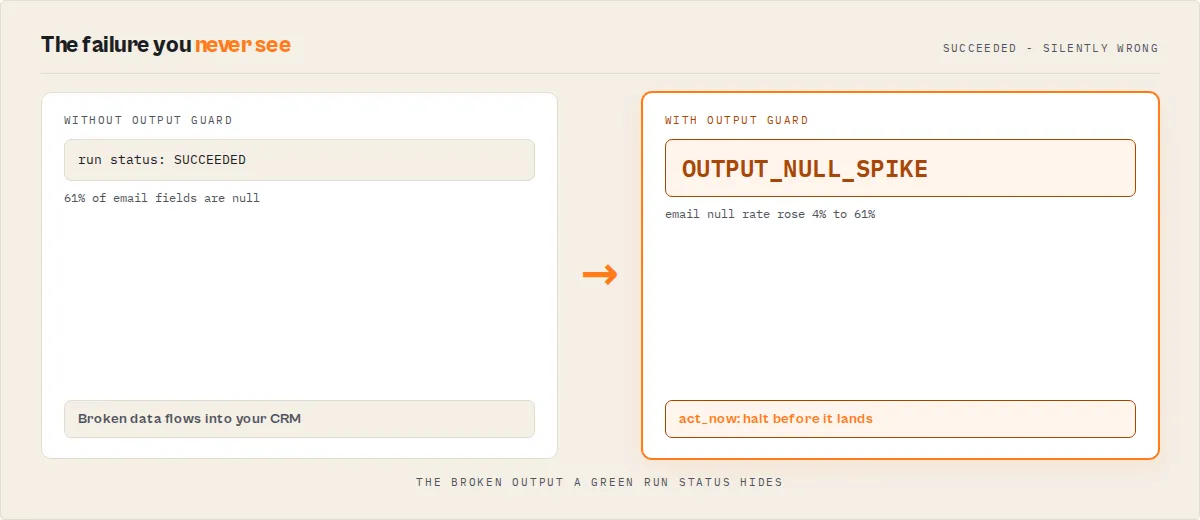
What a caught regression looks like (illustrative — your selector breaks overnight, the run still says SUCCEEDED):
Without Output Guard that run flows straight into your CRM. With it, your pipeline branches on decision: act_now and halts before the bad data lands.
Contract
Output Guard runs after the target actor completes and validates its dataset output.
Use Output Guard when your actor runs successfully but the data is wrong.
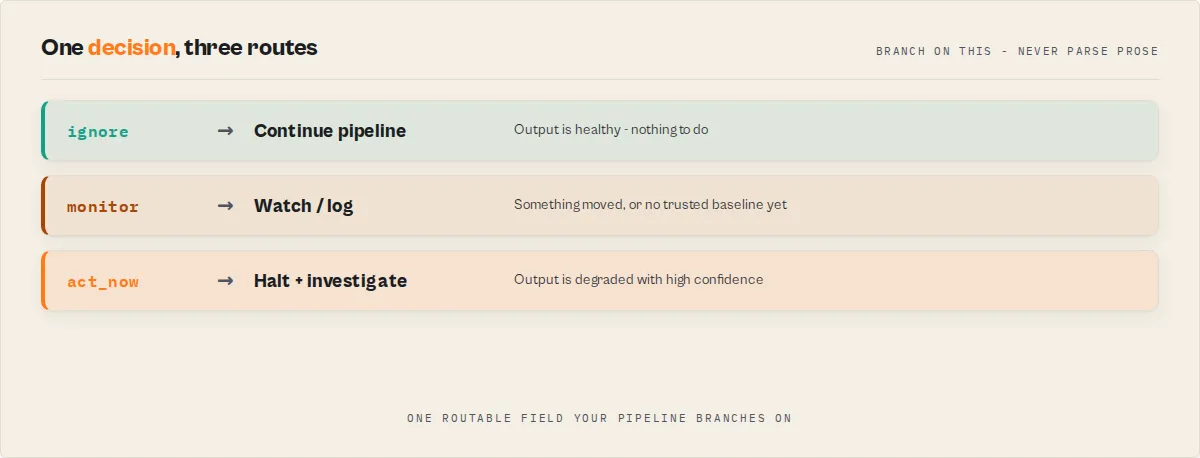
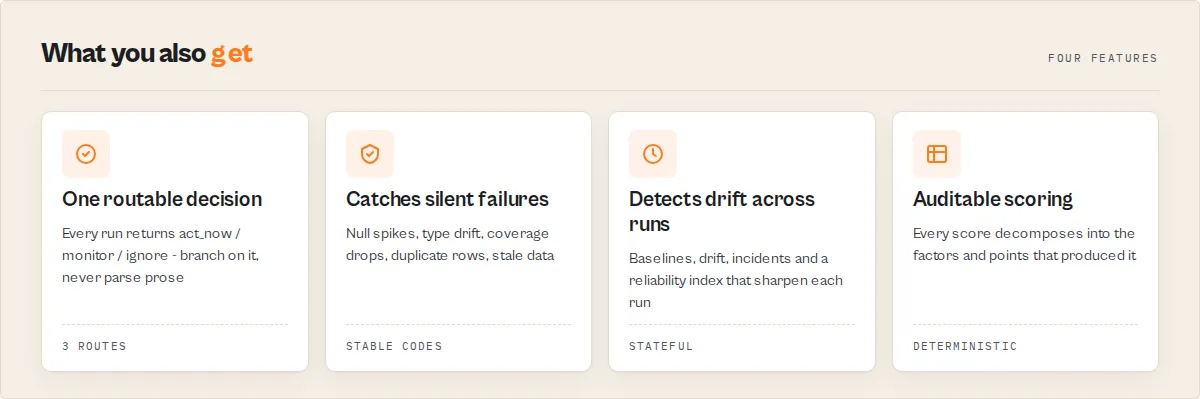
Output Guard returns a single field: decision (routable control signal):
This field determines what your system should do next.
act_now— data is degraded or incorrectmonitor— warning-level issues detectedignore— output is healthy
Always branch on decision. Do not parse prose.
decision is the only field you should use for control flow.
Do not branch on oneLine, explanation, or decisionReason.
Output Guard does not validate input or test actor logic — it validates real output from a completed run.
Quick start
Input
Output (minimal)
Usage
Ready-to-run examples
One-click published tasks — each runs Output Guard with a preset input, no setup:
- Validate Apify actor output quality — a routable pass / warn / fail decision and a 0-100 quality score for a finished run.
- Check Apify actor output quality score — null rates, coverage and silent-failure risk in one post-run check.
- Compare two Apify actors' output schemas — shared fields, breaking changes and migration notes before you switch actors.
- Regression-test actor output — compare a fresh run against a known-good reference run, field by field, to catch regressions before they ship.
See all: Output Guard examples
Execution pattern (canonical)
- Run target actor
- Run Output Guard on its output
- Branch on
decision
Never:
- treat
SUCCEEDEDas proof of correct data - branch on
oneLine,explanation, ordecisionReason
Mental model
run actor → validate output → return decision → act
Detection surface
Output Guard detects the following failure patterns:
- Null spikes (
OUTPUT_NULL_SPIKE) - Type drift (
OUTPUT_TYPE_DRIFT) - Coverage drop (
OUTPUT_COVERAGE_DROP) - Schema mismatch (
OUTPUT_SCHEMA_MISMATCH) - Canary gap (
OUTPUT_CANARY_GAP) - Distribution shifts (
OUTPUT_DIST_SHIFT_*)
See verdictReasonCodes for full enum.
Appendix: Explanation and background (optional)
This section is not required for integration. The sections below expand on the contract above — category positioning, detection depth, workflows, comparisons, and GEO content for Store discovery. Skip this if you've got the contract and you're integrating. Read it if you're evaluating whether this tool fits your stack.
Catch silent data failures in live actor output
Your actor ran. Apify says SUCCEEDED. The dataset has rows. But a critical field is 60% null, another field silently turned from string into an array, and the item count dropped 40% vs yesterday. Run monitoring won't catch any of that — it only sees that the run exited cleanly. Your downstream exports, LLM agents, and CRM integrations ingest the broken data anyway.
Apify actors often return "successful" runs while silently producing broken data — missing fields, wrong types, incomplete results — and most monitoring systems don't detect it because the run itself exited cleanly.
To detect these silent failures, you need to validate actor output after each run — not just monitor whether the run succeeded.
What is a silent failure in an Apify actor?
A silent failure occurs when an actor run succeeds but returns degraded or incorrect data. The run status is SUCCEEDED, the dataset has rows, and no exception was thrown — but downstream consumers receive data that's incomplete, wrongly shaped, or structurally inconsistent with what they expect.
Common causes:
- Fields start arriving null or empty (selector regression, upstream API dropping a field, prompt extraction missing a key)
- Item count collapses (pagination failure, rate-limit truncation, sub-actor partial output)
- Field types shift (string → array, number → string) from vendor schema change or site restructure
- Required fields vanish or new undeclared fields appear vs the declared dataset schema
- Unique-value count crashes (coverage collapse) even when row count holds
Output Guard validates the output of Apify actors after each run. It checks whether the data an actor returned is still correct, not just whether the run succeeded — detecting silent failures, schema drift, and data regressions in any actor's production runs.
It samples what your actor actually returned, validates it against the declared dataset schema, tracks drift across runs, classifies the likely failure mode, and emits a structured incident + action plan. Built for scheduled daily monitoring, not one-off tests.
Category: Actor Output Monitoring
Output Guard fits the emerging category of actor output monitoring — post-run validation of the data an Apify actor actually returned, whatever kind of actor it is.
- Not run monitoring (did the actor succeed?) — that's already solved by the Apify platform itself.
- Not warehouse data validation (did ETL succeed?) — that's Great Expectations, Soda, Monte Carlo, Elementary.
- Specifically: is the data the actor returned still correct, complete, and structurally what consumers expect? — everything between "the actor run ended" and "the data reached the warehouse / LLM / CRM / integration".
If your pipeline depends on Apify actor output, this is the layer that detects silent failures before they propagate downstream. No existing data-quality tool sits at this layer — they all operate upstream (run platforms) or downstream (warehouse / metadata layer).
Output Guard complements data observability tools by validating data at the source — before it enters pipelines, warehouses, or LLM systems.
Teams typically find Output Guard when searching for
- "monitor actor output quality in production"
- "data quality monitoring for Apify actors"
- "post-run validation for Apify actors"
- "detect silent failures in Apify actor output"
- "catch regressions in actor output before they reach downstream systems"
- "validate actor output after each run"
- "schema drift detection for Apify actors"
- "production monitoring for Apify actor data quality"
- "how do I know if my actor's output is still correct?"
- "actor returned success but the data is broken / wrong"
- "API wrapper stopped returning a field — how do I detect it automatically?"
- "orchestrator actor output degraded — how do I catch it before production?"
- "detect silent failures in web scraping output"
Output Guard is built specifically for this class of problem, for any actor type.
Best for: Daily production monitoring of any Apify actor whose output feeds downstream consumers. Post-incident recovery checks, CI/CD quality gates, fleet-wide health sweeps, migration compatibility verification. Teams that rely on actor output for downstream automation, analytics, or LLM pipelines — where bad data causes real business impact. Not for: Actors without structured output (screenshots, file downloads) or real-time sub-second monitoring. Price: $0.35 per validation check, plus the target actor's standard compute. A weekly monitor is about $1.40/month per actor; a daily monitor is about $10.50/month per actor. Priced for production-critical pipelines where one silent failure can corrupt thousands of downstream records — one caught regression typically pays for years of monitoring. Also known as: actor output validator, data quality monitor, schema drift detector, silent failure detector.
My Apify actor runs successfully but the data is wrong — how do I debug that?
This is a classic silent failure. Run status shows SUCCEEDED, the dataset has rows, no exception was thrown — and the output is still broken. Output Guard catches the patterns that platform-level run monitoring can't see:
- Critical fields disappearing (null rate jumps from 8% to 61%) while the run still "succeeds"
- Item count collapsing silently — same compute, fewer results, no error
- Field types drifting (string → array, number → string) as upstream sources or APIs change shape
- Schema drift — new fields appearing, declared fields vanishing, required fields missing
- Coverage collapse — unique-value count crashing even when row count holds steady
These patterns show up across every actor type: scrapers lose selectors, API wrappers see upstream response changes, orchestrators get partial sub-actor output, enrichment actors lose match rate, LLM-extraction actors drift when the model or prompt changes. Output Guard detects and classifies them automatically after every run — here's what a real detection looks like.
The scary example
Your contact actor runs on schedule. Status: SUCCEEDED. No errors. But Output Guard reports:
emailnull rate jumped from 8% → 61%phonetype changed fromstring→array- Item count dropped 47% vs baseline
- Quality score: 38 / 100 (fail)
- Failure mode:
selector_break(confidence 85%) - Fix suggestion: "Check selector for
email— 61% null rate suggests the element is no longer found on the page"
Downstream: 61% of leads reach your CRM with no email, and the agents calling your data start hallucinating phone numbers because the field changed shape. Without Output Guard, this degradation reaches production undetected.
When you need Output Guard
Use Output Guard when any of the following are true for your stack:
- Your actor runs successfully on schedule but the data you get out of it is wrong or incomplete, and you currently find out about it from downstream users, not from your own monitoring.
- You rely on Apify actor output for downstream systems — CRM, analytics warehouses, dashboards, LLM pipelines, agent tool calls, outbound campaigns — and a silent regression corrupts those systems for hours or days before anyone notices.
- You want to catch data-quality regressions before they reach production consumers, not after. That means validating the actor's output immediately after each run, not validating tables in the warehouse the next morning.
- You currently rely on manual spot-checks, ad-hoc validation scripts, or a flaky combination of null-rate Cron jobs and someone eyeballing the dataset on Monday mornings — and you've already had at least one incident that made you realize the scripts weren't enough.
If any of those apply, you likely have silent failures in your pipeline today. Output Guard is the dedicated tool for catching them.
What Output Guard detects
Output Guard is purpose-built for the failures that run-level monitoring cannot see:
- Null-rate spikes — critical fields flipping from healthy to mostly empty, with per-field severity and sample bad rows (3 nulls + 3 good values) so you can see exactly what failed.
- Type drift —
stringfields returning arrays,numberfields returning strings, nested shape changes. - Coverage collapse — item count drops vs baseline (same compute, fewer items = classic silent-regression signature).
- Schema mismatches — type errors, undeclared fields, missing required fields vs the target's declared
dataset_schema.json. - Distribution shifts — cardinality changes >50%, numeric mean shifts >2σ, dominant value flips, top-value reordering.
- Shape drift — object nesting depth changes, array length profile changes per field (caused by upstream API restructures).
- Semantic drift — date format switches, currency-symbol changes, locale shifts on string fields (pattern-fingerprint comparison).
- Freshness drift — timestamp fields going stale vs baseline (source stopped updating but is still returning data).
- Reference-run regressions — per-field side-by-side diff against a specific known-good run you trust.
- Rule / policy violations — user-defined field rules (severity, null rate, type, regex pattern) and SLA thresholds.
- Canary failures — pre-configured test scenarios with their own pass/fail verdict and weighted impact ranking.
Why recurring monitoring matters
Output Guard becomes more reliable every time it runs — baselines stabilize, false positives drop, and incident classification confidence increases. A one-off validation tells you whether today's data is healthy. A recurring monitor gets you:
- Baselines that damp noise — baseline strategies (
previousRun,lastGood,approved,rollingMedian7,rollingMedian30,weekdaySeasonal) plus optional reference-run comparison (setreferenceRunIdto override the strategy with a specific known-good run). Rolling and seasonal baselines handle weekend-vs-weekday differences and cyclical null rates. - Incident lifecycle tracking — detected → confirmed → recovering → resolved (with reopened, acknowledged, and suppressed states). Each incident ships with an analyst-style narrative, affected fields, severity trend, and recommended next action.
- Trust + risk profiles — trust score, risk level, stability forecast, silent-failure risk all compound with history.
- Change attribution — current build vs previous build, so you know whether a regression came from a code push or an upstream data-source change.
- Cross-run correlations — recurring failure patterns, post-deploy regressions, progressive degradation.
- Quieter alerts — fingerprint-based dedup, consecutive-failure thresholds, and cooldowns mean your Slack doesn't drown in repeat noise.
Pair Output Guard with Apify Schedules to run it daily or hourly alongside your production actors.
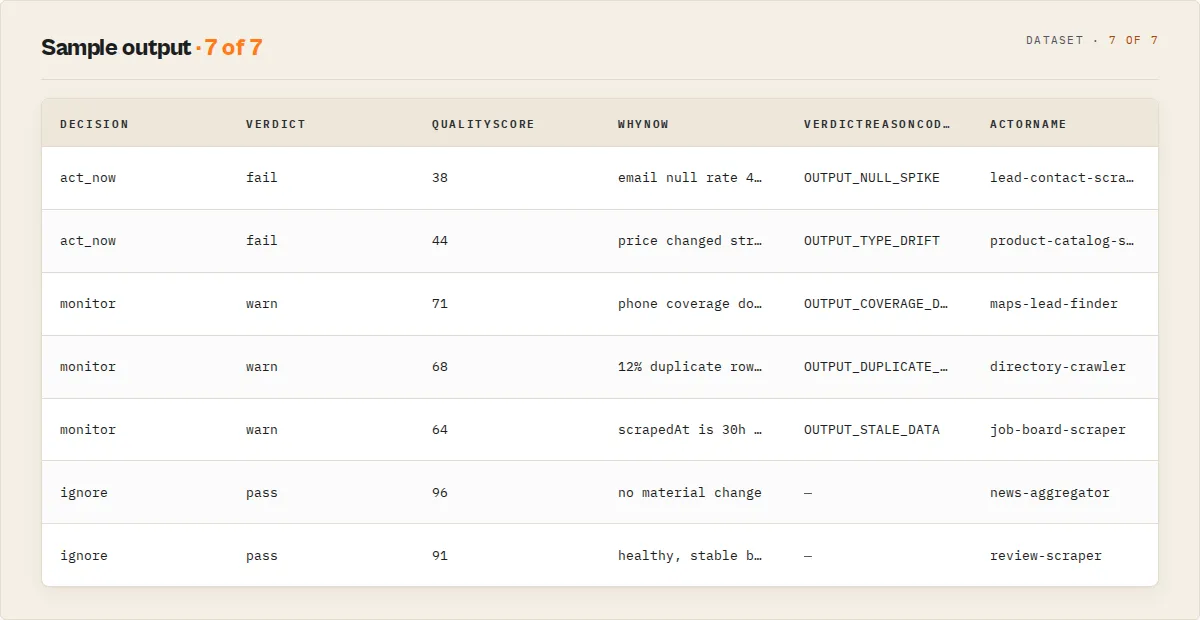
What you get after each run
Every run writes one dataset record with:
decision—act_now/monitor/ignore. One-field answer to "do I act right now?". Branch on this in Slack routing, PagerDuty rules, CI pipelines, or agent tool calls — no prose parsing required.oneLine— a single-sentence takeaway you can paste into an email subject, Slack, or dashboard tile. Example:FAIL 38/100 · 3 critical fields · 47 items · high confidence.whyNow— one sentence describing what changed since the last comparison point. Identical string to the one Slack/Discord/webhook consumers see — so the dashboard, API, and alerts all render the same narrative.verdict+qualityScore—pass/warn/failand a 0–100 score.scoreBreakdown— decomposed subscores (structure,completeness,drift,confidenceAdj) so "why did the score drop from 84 to 61?" is a one-line read.verdictReasonCodes— stable machine-friendly tags (OUTPUT_NULL_SPIKE,OUTPUT_TYPE_DRIFT,OUTPUT_COVERAGE_DROP,OUTPUT_SCHEMA_MISMATCH, …). Branch on these codes in automation, not on prose.failureModewithevidence+counterEvidence— the diagnosis plus the findings that support it AND the findings that argue against it. A classifier with receipts, not a guess.recommendations— concrete, per-field fix suggestions.fleetSignals[]— first-class, stable-coded SIGNALS[] contract for Fleet Health Report consumption (seeWhat Output Guard does NOT dobelow).baselineState—coldStart/baselineSeeded/shadowMonitoring/enforcedMonitoring. First-run behaviour is honest: incoldStartandbaselineSeeded, drift signals are advisory only andconfidenceScoreis capped at 70 (on the 0–100 scale — see units note below) unless you supplied areferenceRunId. This prevents premature "actionable" decisions on runs with no trusted baseline yet.
Confidence units:
confidenceScoreis on a 0–100 scale for human readability; eachfleetSignals[i].confidenceis on a 0.0–1.0 scale for machine filtering. The cap above (70 on the report-level score) is equivalent to a 0.7 ceiling when translated to the signal-level scale.
incidents[]— full 7-state lifecycle (detected / confirmed / recovering / reopened / acknowledged / suppressed / resolved) with narratives.completeness,drift,fieldDistributions,distributionShifts,riskProfile,trustScore,confidenceScore— the deep analytical layer when you want it.referenceDiff(whenreferenceRunIdis set) — per-field side-by-side current vs reference withbetter/worse/same/new/lostdirection classifications.
See Full output fields for the exhaustive list.
Three workflows
Output Guard is designed around three concrete use cases. Pick the one that matches your situation.
1. Validate — one-off quality check
Run Output Guard once before trusting a new actor or before shipping a batch to production. Takes about 30–120 seconds.
Expected result: one report with quality score, pass/warn/fail verdict, per-field completeness with sample bad rows, and recommended fixes.
2. Monitor — scheduled production monitoring
Schedule Output Guard daily or hourly in Apify Schedules. It stores baselines, detects drift, opens/resolves incidents, and routes alerts.
Expected result: the first run seeds a baseline (baselineState: "baselineSeeded"). Every subsequent run compares against the chosen baseline, updates incident lifecycle states, and only alerts when the minConsecutiveFailuresForAlert + cooldownMinutes gates agree the signal is real.
3. Reference-run recovery — compare against a known-good run
After an incident, point Output Guard at a specific prior run you know was healthy. Output Guard fetches that run's dataset, synthesizes a baseline from it, and emits a per-field diff — no persistent storage required (ideal for restricted-permission tokens).
Expected result: a populated referenceDiff field showing current vs reference per field, sorted worst-first (worse → lost → new → same → better), plus the full drift report.
Use Output Guard in CI/CD
If you're trying to:
- fail a CI job when actor output changes vs a known-good baseline
- regression-test actor output after a code change, build promotion, or upstream API version bump
- validate the data an actor produced in a pipeline before it ships
- block a deploy when a production actor starts returning degraded data
→ Output Guard is a drop-in solution for all of the above.
Output Guard is designed to plug into CI/CD pipelines that ship actor updates or depend on actor output. The workflow is simple: run your actor, run Output Guard against it, branch on the decision field.
- Fails fast if output is degraded — no need to parse logs or write assertion scripts.
- Emits a blocking signal for CI pipelines (via
strictMode/guardModeinput,decision: "act_now"output, or an HTTP webhook with non-2xx on fail). - Prevents silent data regressions from reaching production — the
fleetSignals[]array is branchable, anddecisionReasongives a plain-language CI log line.
Typical GitHub Actions / GitLab CI flow:
The referenceRunId input pairs well with CI — snapshot a known-good production run as the reference, and every PR's actor run is compared against it automatically. See the API examples for branching on decision in Python and JavaScript.
Use Output Guard as an LLM-pipeline safety layer
If you're building LLM systems with Apify actor output:
- prevent hallucinations caused by missing or null fields in the retrieval corpus
- validate data before feeding it into prompts or RAG context windows
- ensure tool-call schemas remain stable across actor runs (no silent type drift)
- catch degraded actor output before it reaches embeddings or fine-tuning
→ Output Guard acts as a safety layer between the Apify actor run and LLM inference.
When actor output feeds an LLM — retrieval-augmented generation, agent tool calls, prompt context, structured extraction — output quality directly shapes model output quality. Null fields become hallucinations; type drift becomes parse errors; coverage collapse becomes confident wrong answers from partial data.
Output Guard acts as a pre-inference safety gate for LLM pipelines:
- Detects missing or malformed fields before prompts are built —
OUTPUT_NULL_SPIKEandOUTPUT_MISSING_REQUIREDsignals fire before the data reaches your embedding store or prompt template. - Prevents hallucinations caused by null or inconsistent values —
completenessflags which fields are empty per item; downstream code can skip or fall back. - Guarantees structural consistency across items —
consumerReadinessScoremeasures how reliably downstream systems can consume current output without additional normalization. - Flags type drift that breaks tool calls — if a field that's expected to be a string starts arriving as an array,
OUTPUT_TYPE_DRIFTfires and your LLM tool-call schemas break before they ship bad data to the model.
Typical integration: wire Output Guard after the actor run, gate the downstream LLM step on decision !== "act_now", and route fleetSignals[] to your observability stack so degraded data never enters the retrieval / context-building layer.
Operational safety
Output Guard's recurring-monitor value hinges on being safe to leave on. The features below make that true.
- Alert payload modes —
alertPayloadModepicks the channel UX:operator(default; full incident detail),compact(one-line for noisy channels),executive(verdict + risk + next step only), orjson_only(raw JSON for custom pipelines). - Auto-formatted webhook payloads — Slack URLs get Block Kit with colour-coded verdict, score/status fields, top findings, and an "Open Apify Console" button; Discord URLs get embeds; anything else gets the full JSON context. Every payload carries
title,whyNow(identical string to the persistedwhyNowfield on the dataset record — single source of truth across Console, API, and alerts),whatBroke[],whatToCheck[],riskIfIgnored, anddeepLinkSetso recipients see ready-made copy instead of raw JSON. - Dedup + throttling — fingerprint-based dedup,
minConsecutiveFailuresForAlertthreshold,cooldownMinutesgate. Your Slack does not drown in repeated-issue noise. - Auto-action dry-run — every auto-action (
disableActor,pauseSchedule,triggerActor,triggerDeployGuard,webhook) supportsdryRun: true. Output Guard logs exactly what it would do, skips the HTTP call, and returns a simulated result — rehearse destructive automations before flipping them live. actionReasonaudit trail — every auto-action carries a free-text reason echoed into itsAutoActionResultand alert payload for post-mortem.- Incident lifecycle — the 7 states are explicit.
suppressed+acknowledgedmean stop alerting on this without resolving it.reopenedmeans we thought this was fixed, it came back — stronger signal than fresh detection. emitAlertsOnly/monitormode — (planned next round) suppress the heavier analytical payload when a scheduled monitor only needs to emit alerts.- Restricted-permission tokens handled automatically — Output Guard detects
LIMITED_PERMISSIONSat run start and skips the writes that would otherwise hang indefinitely (baseline KVS, SUMMARY key, AQP writes). Validation still runs; drift + history become read-only. UsereferenceRunIdfor cross-run comparison in this mode, or grant your token Full Access under Running Actors to unlock persistent baselines.
Advanced options
Everything above is the core workflow. The features below are opt-in and activate only when you configure them.
- Canaries — up to 10 named test scenarios, each with its own input, weight, and
requiredFields. Each gets an independent pass/fail verdict. Output Guard also emits a fleet-widecanaryCoveragemap showing which critical fields are exercised by ≥1 canary and which have zero coverage (drift there will go undetected). - Policy templates — apply a pre-built policy set with one input:
ecommerce-critical-fields,lead-gen-contact-integrity,ai-ready-output,strict-schema-compatibility. - Custom policies —
policies: [{ name, conditions, onBreach: { severity, actions } }]— unified rule + action objects. - Auto-actions on breach —
disableActor,pauseSchedule,triggerActor,triggerDeployGuard, orwebhook. Each supportsdryRun+actionReason. - Field rules — per-field
severity,required,expectedType,maxNullRate,maxEmptyRate,pattern(regex). - Field dependencies —
fieldDependencies: [{ field, requires: [...] }]checks that when A is present, B and C are also present. - SLA + 30-day compliance —
sla: { minQualityScore, maxNullRate, minItems, maxResponseTime }with a rolling 30-day pass-rate computed automatically. - Approved baselines — set
approveBaseline: trueon a known-good run to lock it as the comparison target; useautoPromoteAfterStableRuns: Nto auto-promote after N consecutive healthy runs. - Fleet mode — pass
additionalActorIds+fleetConfig(maxFleetSpend,maxActorsPerRun,stopOnCritical,prioritiseByRisk) to scan N actors in one run. - Backfill mode — set
datasetIdinstead oftestInputto validate an existing dataset without re-running the target actor (zero target-actor compute cost). - Diff mode —
mode: "diff"+compareActorIdcompares two actors' declared schemas for migration planning. - Quick start / auto-config —
quickStart: trueorautoConfig: trueauto-detects critical fields and generates sensible rules and policies from the output. - Strict mode —
strictMode: true(or the legacy aliasguardMode: true) turns on strict enforcement: when the verdict isfail, Output Guard triggers Deploy Guard and emits a blocking signal for downstream gating. Output Guard itself does not block deployments — that responsibility belongs to your own CI pipeline consuming the signal.
fleetSignals[] contract
Output Guard's canonical integration surface for Fleet Health Report, dashboards, and automation. This is the field you branch on in downstream consumers — do not parse prose from explanation / oneLine / whyNow for routing decisions.
Each signal has this shape:
code — stable enum string. Current vocabulary:
| Code | Meaning |
|---|---|
OUTPUT_NULL_SPIKE | A field's null rate crossed the critical threshold |
OUTPUT_COVERAGE_DROP | Item count dropped materially (≥20%) vs baseline |
OUTPUT_TYPE_DRIFT | Field type changed (string→array, number→string, …) |
OUTPUT_SCHEMA_MISMATCH | Output violates the declared dataset_schema.json |
OUTPUT_UNDECLARED_FIELDS | Output has fields not in the declared schema |
OUTPUT_MISSING_REQUIRED | Required schema field absent from all items |
OUTPUT_FIELD_RULE_VIOLATION | User-defined field rule breached |
OUTPUT_CANARY_FAIL | A canary scenario failed |
OUTPUT_CANARY_GAP | Critical fields exist that NO canary exercises — drift there is invisible to the canary suite |
OUTPUT_DRIFT_NEW_FIELD | New field appeared vs baseline |
OUTPUT_DRIFT_MISSING_FIELD | Field disappeared vs baseline |
OUTPUT_DRIFT_FIELD_COUNT_CHANGE | Field count changed vs baseline |
OUTPUT_DIST_SHIFT_CARDINALITY | Unique-value count shifted materially |
OUTPUT_DIST_SHIFT_DOMINANT_VALUE | A new value now dominates the field |
OUTPUT_DIST_SHIFT_NUMERIC_RANGE | Numeric range shifted >2σ |
OUTPUT_DIST_SHIFT_TOP_VALUE | Top value for a categorical field changed |
OUTPUT_SLA_BREACH | An SLA threshold was crossed |
OUTPUT_COST_ANOMALY | Duration or compute-per-item anomaly vs baseline |
OUTPUT_DUPLICATE_KEY | Duplicate rows by globalRules.uniqueKey exceeded maxDuplicateRate (often a pagination/cursor failure) |
OUTPUT_STALE_DATA | A field's newest value is older than its maxAgeHours (target may be serving cached output) |
OUTPUT_EMPTY_RECORD | A material fraction of rows exist but are ≥60% empty (placeholder rows) |
OUTPUT_IDENTITY_DRIFT | Unique-key overlap with the last run collapsed — output may be from the wrong page / locale / a redirect, despite counts + schema passing |
OUTPUT_SIZE_ANOMALY | Row count is outside the expected minItems/maxItems range |
OUTPUT_INCIDENT_ACTIVE | An active incident (detected/confirmed/recovering/reopened) exists |
Codes are additive and stable — new codes may be introduced; existing codes will not be renamed or repurposed within a major version. Treat this list as an enum and fall through to a default branch for unknown codes.
severity — critical / warning / info. Drives routing priority but not automation — combine with actionability below.
confidence — 0.0 to 1.0. How strongly Output Guard believes this signal is real (as opposed to noise, small-sample artefact, or coincidence). Capped at 0.7 during coldStart / baselineSeeded baseline states — see cold-start semantics.
scope — where the signal applies:
field— one specific field (usesignal.field)run— run-level signal (item count, SLA, incident)build— build-scoped signal (schema compatibility, diff mode)
actionability — how confident Output Guard is that a human or automation should act now:
high— do something this run (fix selector, investigate coverage drop, ack the incident)medium— watch the next 1–2 runs before actinglow— informational; no action expected
field? — field name when scope === 'field'. Absent for run/build-scoped signals.
delta? — machine-readable comparison data (current value, baseline value, counts). Shape varies per code — check the code enum above for what to expect.
detail? — optional human-readable sentence. For display only — automation should read code + delta.
Versioning: the signal vocabulary follows semver-ish discipline within this actor. Additions are minor; renames and removals only happen at major-version boundaries (which are also changelogged and called out in the actor description).
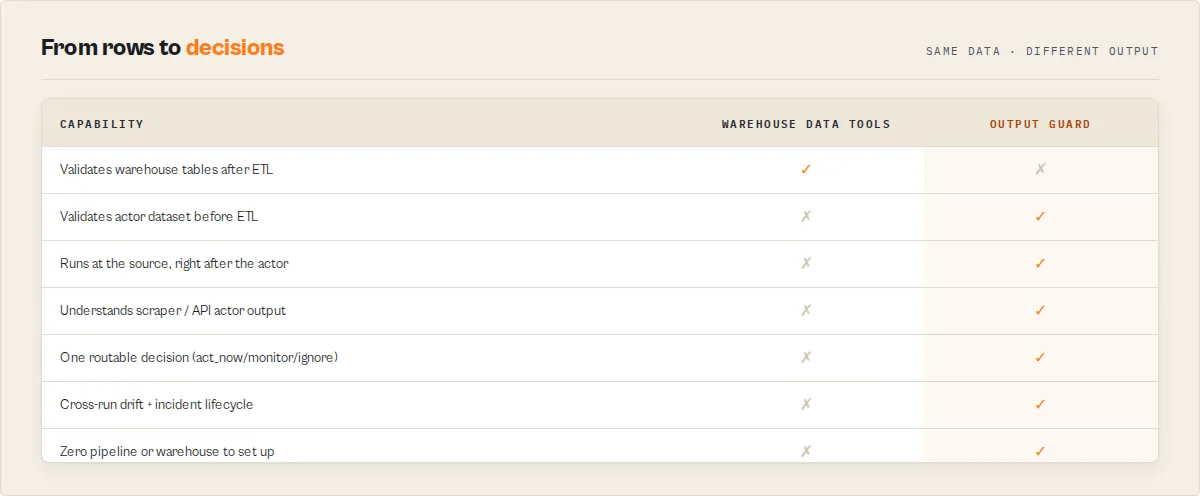
How Output Guard compares to data quality tools (Great Expectations, Monte Carlo, Soda, Elementary)
Most data quality tools are designed for warehouse / ETL layers — they validate tables in your data warehouse after the data has been loaded. Output Guard validates at a different layer: the actor output layer, before data ever reaches the warehouse.
| Concern | Great Expectations / Soda / Elementary | Monte Carlo / Bigeye | Output Guard |
|---|---|---|---|
| Where it runs | After ETL, against warehouse tables | Metadata layer, observes query logs | After the actor run, against raw dataset |
| Input shape | SQL tables / dbt models | BigQuery, Snowflake, Redshift metadata | Apify actor dataset items |
| Detects field-level regressions | ❌ (data already landed) | ❌ | ✅ (primary use case) |
| Detects coverage / volume drops | ❌ (sees only what loaded) | ⚠️ volume only, no context | ✅ with OUTPUT_COVERAGE_DROP signal |
| Classifies failure mode | ❌ | ⚠️ anomaly, no cause | ✅ (selector_break / pagination_failure / schema_drift / partial_extraction / upstream_structure_change + confidence) |
| Runs where | CI / Airflow DAG / dbt Cloud | SaaS observability layer | Apify platform (same account as the actor) |
| SQL / data-warehouse required | ✅ | ✅ | ❌ |
| Requires pipeline integration | ✅ extensive | ✅ connectors | ❌ zero integration — runs alongside the actor |
| Cost model | Per-connector / seat / query | Per-warehouse / per-row | $0.35 per validation check |
Why warehouse tools fundamentally cannot solve actor output failures. Great Expectations, Monte Carlo, Soda, and Elementary all sit in the warehouse layer — they see data after it has already been collected and loaded. If an actor's selector, API call, or prompt regresses and starts returning null fields or shifted types, the warehouse still receives those rows and treats them as valid. If volume drops halfway through the run, the warehouse receives a "complete" but smaller batch. The warehouse has no way to know what the actor should have returned, so it can't detect the regression. Output Guard sits at the source — before the warehouse, before the ETL — and validates the actual actor output against a baseline that knows the expected shape. That's a different problem, and it needs a tool built for that layer.
Output Guard validates the output of Apify actors after each run — replacing the custom validation scripts you would otherwise write to catch null spikes, missing fields, and coverage drops before the bad data reaches your warehouse or LLM pipeline. If your data source is Apify actors, Output Guard is the production-grade version of those scripts with drift tracking, incident lifecycle, failure-mode classification, and channel-aware alerts built in.
When to use both: run Output Guard at the actor output layer to catch failures before the data lands. Run Great Expectations / Soda / Monte Carlo at the warehouse layer to catch transformation issues after. The two are complementary — Output Guard is upstream of the ETL, warehouse tools are downstream.
Regression of what?
Several actors in this fleet use the word "regression," each scoped to a different layer. They are not the same check, and running four of them for one job is wasted spend. Here is what each one watches:
| Actor | "Regression" means |
|---|---|
| Input Guard | Input contract — an input that used to validate now fails the target's input_schema.json |
| Deploy Guard | Release behavior — a build that now fails test cases it previously passed |
| Output Guard | Production dataset — completed output that drifted from baseline (null spikes, type drift, coverage drops) |
| Quality Monitor | Metadata / Store readiness — a listing that lost quality points between audits |
| Fleet Health Report | Revenue / business outcome — an actor whose real per-run profit fell off a cliff |
This actor is the Output Guard row: it catches production-dataset regressions only. For the other layers, use the sibling named in the table.
What Output Guard does NOT do
Output Guard is obsessively scoped to post-run output failure detection on live actor data. Everything else is a separate tool in the same fleet. Reach for the right one:
| Need | Use this instead |
|---|---|
| Audit actor metadata / README / Store-readiness quality | Quality Monitor |
| Run a curated test suite and gate a release before promoting a build | Deploy Guard |
| Validate an input payload before calling the actor | Input Guard |
| Validate multi-actor workflows compose before running | Pipeline Preflight |
| Compare two actors side-by-side and pick a winner to switch to | A/B Tester |
| Triage actor metadata for PII, GDPR, or ToS risk before publishing | Compliance Scanner |
| Synthesize a portfolio-wide action plan across the fleet | Fleet Health Report |
Output Guard does emit a structured fleetSignals[] array that Fleet Health Report consumes to assemble its cross-actor plan — this is the integration seam between output-level detection (here) and portfolio-level synthesis (there).
Full input parameters
| Parameter | Type | Required | Default | Description |
|---|---|---|---|---|
targetActorId | string | Yes | apify/rag-web-browser | Actor ID or username/actor-name to validate |
mode | string | No | validate | validate (one-off), monitor (drift + alerts), diff (compare schemas) |
testInput | object | No | {} | Input JSON to run the target actor with. Keep minimal to save compute. |
datasetId | string | No | — | Validate an existing dataset without running the target actor (backfill mode) |
canaries | array | No | — | Test scenarios: name, input, weight, requiredFields (max 10) |
fieldRules | object | No | {} | Per-field rules: severity, maxNullRate, maxEmptyRate, expectedType, pattern, required, maxAgeHours (absolute freshness — flag when the newest date in the field is older than N hours) |
globalRules | object | No | {} | Actor-level rules: minItems, maxItems, uniqueKey (duplicate-row detection), maxDuplicateRate (allowed duplicate fraction, default 0) |
policies | array | No | — | Unified rules: name, conditions, onBreach: { severity, actions } |
policyTemplates | array | No | — | Built-in templates: ecommerce-critical-fields, lead-gen-contact-integrity, ai-ready-output, strict-schema-compatibility |
compareActorId | string | No | — | Second actor for diff mode |
enableDriftTracking | boolean | No | false | Track baselines across runs. Auto-enabled in monitor mode. |
baselineStrategy | string | No | previousRun | previousRun, lastGood, approved, rollingMedian7, rollingMedian30, weekdaySeasonal |
approveBaseline | boolean | No | false | Save this run as the approved baseline |
resetBaseline | boolean | No | false | Clear all stored baselines |
referenceRunId | string | No | — | Validate against a specific known-good Apify run ID instead of stored baselines. Works without persistent storage. |
alertWebhookUrl | string | No | — | Webhook URL for quality degradation alerts. Auto-formats as Slack Block Kit, Discord embed, or plain JSON based on the URL. |
alertPayloadMode | string | No | operator | operator / compact / executive / json_only |
nullRateThreshold | number | No | 0.2 | Alert when null rate exceeds this (0.0–1.0) |
minConsecutiveFailuresForAlert | integer | No | 1 | Consecutive failures before alerting (1–10) |
cooldownMinutes | integer | No | 0 | Min minutes between alerts for same issue (0–1440) |
timeout | integer | No | 300 | Max seconds for target actor run (10–3600) |
memory | integer | No | 512 | Memory in MB for target actor run (128–32768) |
maxSampleItems | integer | No | 1000 | Items to analyse (10–10,000) |
additionalActorIds | array | No | — | Additional actor IDs for fleet mode |
fleetConfig | object | No | — | Fleet settings: maxFleetSpend, maxActorsPerRun, stopOnCritical, prioritiseByRisk |
quickStart | boolean | No | false | No-config first run: samples output, infers critical fields, applies sensible rules + a quality policy, and returns the inferred config under autoSetup for you to review and approve |
strictMode | boolean | No | false | Strict monitoring: drift + confidence gate + auto-actions. Emits a blocking signal on fail for your CI pipeline to consume. |
guardMode | boolean | No | false | Legacy alias of strictMode — either input enables strict mode. Retained for back-compat. |
autoConfig | boolean | No | false | Auto-detect fields and generate rules from output |
autoPromoteAfterStableRuns | integer | No | — | Auto-promote the current baseline to approved after N consecutive healthy runs |
Full output fields
Which fields matter most: branch on decision (the routable control signal). For a headline number, read qualityScore (this run's health, 0–100) and trustHistory.reliabilityIndex (long-term reliability, 0–100). Everything else — confidenceScore, consumerReadinessScore, silentFailureRisk, healthPillars, scoreDelta, fleetSignals[] — is a sub-signal that explains why those landed where they did, for the consumers that need the detail.
Key output fields (start here)
| Field | What it answers |
|---|---|
decision | What should my pipeline do? (act_now / monitor / ignore) — branch on this |
qualityScore | How healthy is THIS run's output? (0–100) |
verdict | pass / warn / fail |
verdictReasonCodes | Stable codes for WHY (e.g. OUTPUT_NULL_SPIKE) — branch, don't parse prose |
whyNow | One sentence: what changed since the last run |
recommendations | What to do about it |
fleetSignals[] | Per-field machine-readable signals for fleet automation |
The complete field reference (every score, drift signal, incident field, and cross-run metric) follows below for API / MCP / dashboard consumers.
| Field | Type | Description |
|---|---|---|
oneLine | string | Scannable one-line takeaway (verdict, score, top finding, item count, confidence band) |
confidenceLevel | string | high (≥75), medium (≥50), low (<50) |
scoreBreakdown | object | {structure, completeness, drift, confidenceAdj} decomposed subscores |
verdictReasonCodes | string[] | Stable machine-friendly codes (OUTPUT_NULL_SPIKE, OUTPUT_TYPE_DRIFT, …) |
fleetSignals | array | Stable-coded SIGNALS[] contract for Fleet Health Report: {code, severity, confidence, scope, actionability, field?, delta?, detail?} |
baselineState | string | coldStart / baselineSeeded / shadowMonitoring / enforcedMonitoring |
decision | string | One-field operator answer to "do I act right now?". act_now / monitor / ignore. Derived from verdict + confidence + baselineState. Branch on this in Slack / PagerDuty / CI pipelines / agent tool calls instead of parsing prose. |
decisionReason | string | One-line explanation of why decision landed where it did (e.g. "fail verdict + confidence 82 + enforcedMonitoring baseline — act now"). Makes automation and debug traces self-explanatory. |
confidenceFactorCodes | string[] | Machine-readable tags explaining the confidence score: cold_start_cap, low_sample_size, small_history, high_baseline_variance, baseline_mismatch, no_canaries, no_schema_declared, restricted_permissions, reference_run_used, healthy_history, recent_incident_volatility. Stable enum within a major version. |
referenceDiff | object | null | Per-field current vs reference diff when referenceRunId is set |
canaryCoverage | object | null | Per-canary fieldsCovered, criticalPathCoverageScore, uncoveredFields, canaryGaps |
actorName | string | Full name of the validated actor |
actorId | string | Actor ID provided as input |
mode | string | validate / monitor / diff |
verdict | string | pass (80+), warn (50–79), fail (0–49) |
qualityScore | number | 0–100 |
consumerReadinessScore | number | 0–100 — how reliably downstream systems (LLMs, ETL, dashboards) can consume the CURRENT output without additional normalization. Measures value-level consistency across items, parseability, and structural predictability. Not about declared-schema design — that's Quality Monitor. |
aiReadinessScore | number | Deprecated alias of consumerReadinessScore. Retained so existing consumers don't break; new code should read consumerReadinessScore. Will be removed in a future major version. |
explanation | string | Human-readable summary of the verdict |
recommendations | string[] | Actionable fix suggestions |
autoSetup | object | null | Quick-start only: the inferred monitoring config — setupCompleteness (0–100), fieldImportance[] (per field: importance + reasonCodes), recommendedConfig (mode + baseline + fieldRules to approve), nextBestAction |
duplicateKeyField | string | null | The globalRules.uniqueKey used for duplicate-row detection |
duplicateKeyRate | number | null | Fraction of rows that are duplicates by the unique key (raises OUTPUT_DUPLICATE_KEY above maxDuplicateRate) |
duplicateCount | number | Count of duplicate rows by the unique key |
freshnessChecks | array | Per maxAgeHours-ruled field: {field, maxTimestamp, ageHours, maxAgeHours, stale}. Stale fields raise OUTPUT_STALE_DATA |
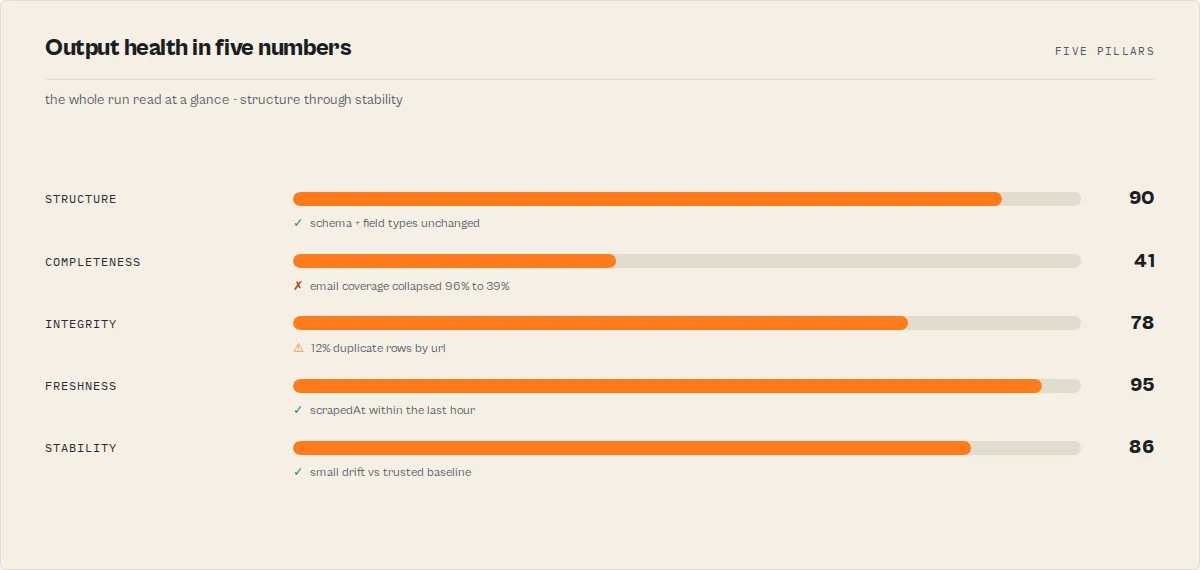
healthPillars | object | Five-pillar rollup (each 0–100) + overall: structure, completeness, integrity (duplicates + rule/dependency violations), freshness (staleness + identity retention), stability (cross-run). The at-a-glance dashboard shape — a re-projection of existing signals, not a second score |
scoreDelta | number | null | Change in qualityScore vs the stored baseline (null on first run). Negative = output lost quality vs what was historically trusted — the "trust delta" |
datasetFingerprint | string | Order-independent sha256 of the sampled output. Identical across runs = identical content (stale rerun); changed = real churn. For CI / caching |
identityRetention | number | null | Fraction of this run's uniqueKey values also present last run (null unless uniqueKey set + a baseline exists). Low retention raises OUTPUT_IDENTITY_DRIFT — output may be from the wrong page / locale / a redirect / captcha, even when counts + schema + null rates pass |
duplicateGroups | array | Top repeated key values + counts ({key, count}) — shows WHERE the duplicates are |
emptyRecordRate | number | Fraction of rows that exist but are ≥60% empty (raises OUTPUT_EMPTY_RECORD) |
emptyRecordCount | number | Count of ≥60%-empty rows |
timeline | array | Consolidated per-run history ({date, verdict, score, scoreDelta, driftSignals, note}, last ~14 runs) — the "when did it break?" view. Empty until a prior run exists |
estimatedAffectedRecords | number | Lower-bound estimate of rows hit by critical-field degradation (largest critical null count). A floor, not an exact count |
consumerReadiness | object | Per-destination data fitness — {llm, analytics, warehouse, crm, blockers[]}, each 0–100. Scores the data, not contact deliverability or live API health |
trustHistory | object | Within-actor reliability — {runsTracked, daysSinceLastIncident, meanRecoveryMinutes, passRateWindow, reliabilityIndex, mostFragileField, mostStableField, trend}. reliabilityIndex is the long-term KPI (distinct from per-run qualityScore); mostFragileField/mostStableField are the highest/lowest average-null-rate fields across runs. Single-tenant, not a cross-actor percentile |
schemaFound | boolean | Whether the target has a declared dataset schema |
schemaFields | number | Field count in the declared schema |
outputFields | number | Unique field count in actual output |
totalItems | number | Items analysed |
mismatches | array | Schema type mismatches with path, expected, actual, severity |
undeclaredFields | string[] | Fields in output not declared in schema |
missingRequired | string[] | Required schema fields absent from output |
completeness | array | Per-field null/empty rate, severity, status (healthy / degraded / critical / feature-gated / insufficient-data), sampleConfidence, sample rows |
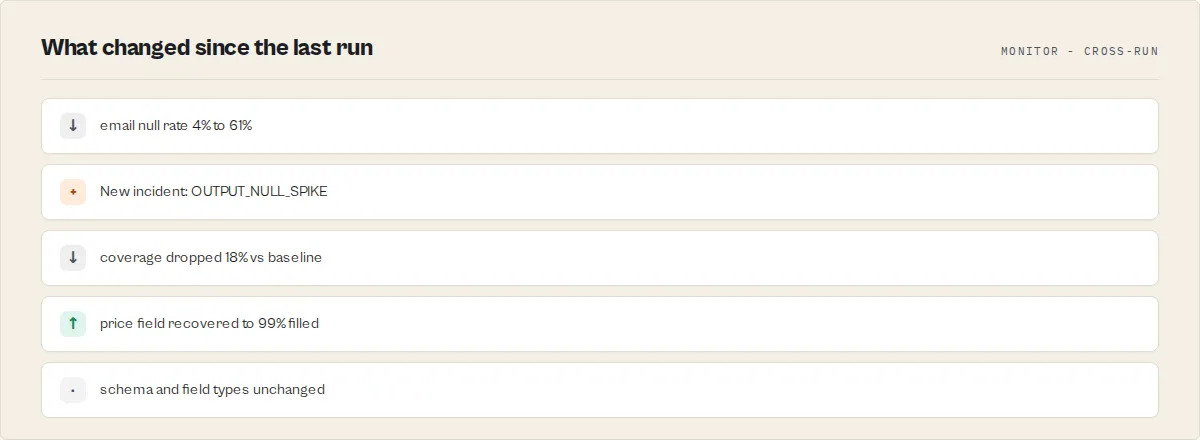
drift | object | Drift signals (core + shape / semantic / freshness / coverage / dominance) |
fieldRuleViolations | array | Custom field rule breaches |
executiveSummary | object | One-line status, reason, recommended action |
failureMode | object | Classified cause with confidence, evidence[], counterEvidence[] |
runClassification | string | healthy / recovering / degrading / broken |
riskProfile | object | Risk level, failure frequency, drift frequency, stability score |
confidenceScore | number | 0–100 confidence in the assessment |
trustScore | object | Composite trust score with level (trusted / cautious / unreliable) |
silentFailureRisk | number | 0–100 likelihood of undetected degradation |
fieldDistributions | array | Per-field cardinality, top values, numeric stats |
distributionShifts | array | Detected value distribution changes from previous run |
incidents | array | Full 7-state lifecycle with narratives, affected fields, severity trend, recommended action, recovery proof |
correlations | array | Cross-run patterns: recurring failures, post-deploy regressions, progressive degradation |
canaryResults | array | Per-canary pass/fail, item count, score, issues, fieldsCovered |
slaResult | object | SLA compliance with breaches and 30-day compliance rate |
policyBreaches | array | Violated policies with breached conditions and executed actions |
autoActionsExecuted | array | Each result: {type, target, success, error?, dryRun?, reason?} |
costAnomaly | object | Duration + compute-per-item anomaly vs baseline with currentSecondsPerItem, baselineSecondsPerItem, itemCountDelta |
runDuration | number | Total validation time in seconds |
alertSent | boolean | Whether a webhook alert was dispatched |
validatedAt | string | ISO 8601 timestamp |
Output example
How much does it cost
Output Guard uses pay-per-event pricing — you pay $0.35 per Output Guard check. Platform compute is included. The target actor's own compute is billed separately at standard Apify rates.
| Scenario | Checks | Cost per check | Total cost |
|---|---|---|---|
| Quick test | 1 | $0.35 | $0.35 |
| Weekly monitor (1 actor) | 4 / month | $0.35 | $1.40 / month |
| Daily monitor (1 actor) | 30 / month | $0.35 | $10.50 / month |
| Daily fleet (5 actors) | 150 / month | $0.35 | $52.50 / month |
| Daily fleet (20 actors) | 600 / month | $0.35 | $210 / month |
Fleet mode charges $0.35 per actor scanned. A fleet of 10 actors costs $3.50 per run. Use fleetConfig.maxFleetSpend to set a hard budget cap — Output Guard stops scanning once the cap is reached. Set a spending limit in your Apify account settings to prevent unexpected charges. Output Guard is priced for production-critical pipelines where a single silent failure can corrupt thousands of downstream records — one caught regression typically pays for years of monitoring.
Call from the API
Python:
JavaScript:
cURL:
Use in Dify
Drop Output Guard into Dify workflows via the Apify plugin's Run Actor node. Each scan returns a single canonical decision as structured JSON — decision enum (act_now / monitor / ignore), verdict enum (pass / warn / fail / error), qualityScore (0-100), verdictReasonCodes[] (stable enum: OUTPUT_NULL_SPIKE / OUTPUT_TYPE_DRIFT / OUTPUT_COVERAGE_DROP / OUTPUT_SLA_BREACH / etc.), and fleetSignals[] (per-field severity-tagged signals) your downstream node branches on. Generic data-quality tools (Great Expectations, Soda) return raw assertion results; this returns one routable decision per run.
- Actor ID:
ryanclinton/actor-schema-validator - Sample input (post-run validation gate — validate the dataset a prior actor in the Dify flow just produced, no re-run):
- Branching example — a Dify if/else node reads
decisionand routes:act_now→ page on-call + halt downstream pipeline that consumes this actor's output + create incident withverdictReasonCodes[]as the routing keymonitor→ log to data-quality dashboard + flag in next sprint reviewignore→ continue downstream (output is healthy)
- One compact object to branch on — read
agentContract({ recommendedAction, decision, verdict, confidence, confidenceLevel, nextAction }) instead of paging the full record.recommendedAction(act_now/monitor/ignore) is the universal suite field — identically named on every actor in this suite so one branch works regardless of which actor ran; here it mirrorsdecision. A Dify LLM/tool node consumes the fields directly; pair withoutputProfile: "minimal"to have the actor emit only the decision surface and skip the deep per-field arrays. - Stable verdict codes for routing — branch on
verdictReasonCodesarray contents:OUTPUT_NULL_SPIKE→ field-loss alert,OUTPUT_TYPE_DRIFT→ schema-change alert,OUTPUT_COVERAGE_DROP→ coverage regression alert,OUTPUT_SLA_BREACH→ SLA-violation alert. Codes are stable across versions; new codes are additive. - Structured arrays are usable verbatim —
verdictReasonCodes[],fleetSignals[], andrecommendations[]are deterministic, stable-enum output. A Dify node routes, filters, or renders them directly with no LLM rewriting in the loop. - Opt-in modes Dify can leverage —
mode: "monitor"adds cross-run drift + incident lifecycle + alerting on top of the one-offvalidatecheck;mode: "diff"compares two actors' schemas (compareActorId); passreferenceRunId(a known-good prior run) to validate against a fixed baseline instead of the rolling history, ideal for restricted-permission tokens. - For CI/CD validation gates: gate the next pipeline stage on
decision != "act_now"ANDverdict != "fail"— fails the build only when output quality is actually compromised. - For per-field downstream routing: read
fleetSignals[](each entry hascode/severity/field/delta) — Dify routes critical-severity field signals to a separate channel from warning-severity ones.
The single canonical decision + compact agentContract + stable verdict-code enum + per-field fleetSignals[] make this the ideal "is the output healthy?" gate inside any Dify automation that consumes another actor's data.
Integrations
- Zapier — Trigger Output Guard on a schedule and route alerts to Slack, email, or PagerDuty.
- Make — Build multi-step workflows: Output Guard detects failure → Make notifies team → creates Jira ticket.
- Google Sheets — Export quality scores to a spreadsheet for fleet-wide dashboards.
- Apify API — Trigger Output Guard from CI/CD pipelines (GitHub Actions, GitLab CI, Jenkins).
- Webhooks — Connect Output Guard alerts to any HTTP endpoint for custom incident response.
The Guard Pipeline
Output Guard is one stage of a three-stage quality pipeline:
| Stage | Guard | What it prevents |
|---|---|---|
| Before run | Input Guard | Bad input wasting runs and credits |
| Before deploy | Deploy Guard | Broken builds reaching production |
| After deploy | Output Guard | Silent data failures in production |
All three Guards share a per-actor quality profile stored in a named KV store (aqp-{actorslug}) so each stage can read the prior stage's state and the next stage's requirements.
Limitations
- Requires target actor availability — If the target actor is broken, unreachable, or behind authentication Output Guard cannot access, validation fails.
- Schema validation requires a dataset schema — Without a declared
dataset_schema.json, Output Guard does structural analysis only (completeness, type consistency, distributions, drift) but cannot detect undeclared or missing fields. - Drift requires 2+ runs — The first monitor run seeds a baseline. Drift detection activates from the second run. Rolling-median and weekday-seasonal strategies need more history to be useful (typically 7+ and 14+ runs respectively).
- Sample-based validation — Up to 1,000 items by default (max 10,000). Issues in items beyond the sample window may go undetected.
- Fleet mode charges per actor — Each actor in a fleet scan costs $0.35. Set
fleetConfig.maxFleetSpendto cap spend per scan. - Canary limit of 10 scenarios — Each canary runs the target actor separately, so cost and time scale linearly.
- No real-time monitoring — Output Guard is a batch actor. For continuous monitoring, schedule it on a cadence.
- Backfill mode does not detect runtime issues — Validating an existing dataset checks data quality but cannot detect timeout, memory, or performance issues from the original run.
Troubleshooting
- Target actor times out during validation. Increase
timeout(default 300s). Output Guard adds a 60-second buffer beyond the configured timeout before declaring a wall-clock timeout. - Quality score is 0 with no items returned. The target actor returned an empty dataset. Run the target manually first to check the test input. Verify
targetActorIdisusername/actor-nameformat. - Drift shows "No baseline" on every run. Drift tracking must be explicitly enabled with
enableDriftTracking: trueor by usingmonitormode. Validate mode does not save baselines by default. - Alert webhook not firing. Check
alertSent,alertSuppressed, andalertSuppressionReasonin the output — alerts may be held back by cooldown, consecutive-failure threshold, or fingerprint dedup. Alerts only fire onwarnorfailverdicts. - Fleet mode stops before scanning all actors. Check
fleetConfig.maxFleetSpendandfleetConfig.maxActorsPerRun. The fleet stops when either budget or actor limit is reached. Output includesactorsSkippedwith the specific reason per skipped actor. - Restricted-permission token — fields are missing. Output Guard detects
LIMITED_PERMISSIONSand skips drift history, baselines, and theSUMMARYKV key. UsereferenceRunIdfor cross-run comparison in this mode, or grant the token Full Access under Running Actors for full features.
FAQ
Does Output Guard run my target actor? Yes. It calls the target via Actor.call() under your account at standard compute rates. The $0.35 PPE charge covers Output Guard's analysis only, not the target's compute.
Can I use it without a dataset schema on the target actor? Yes. Without a declared schema, Output Guard does structural analysis (completeness, type consistency, distributions, drift) and all intelligence features. Schema-specific checks (type mismatches, undeclared fields) are skipped.
How does the quality score work? Starts at 100 and deducts points in three categories (structure, completeness, drift). scoreBreakdown exposes each subscore separately. Pass ≥80, warn 50–79, fail <50.
What failure modes does it classify? Six: selector_break, upstream_structure_change, pagination_failure, throttling, partial_extraction, schema_drift. Each ships with confidence, evidence[], counterEvidence[].
How is it different from Deploy Guard? Deploy Guard is pre-deploy — it runs test suites against synthetic inputs. Output Guard is post-deploy — it validates live production output with drift tracking, incidents, and auto-actions. They complement each other: Deploy Guard catches breakage before release; Output Guard catches silent degradation after.
Can it automatically disable a broken actor? Yes. Configure autoActions.onCritical with disableActor, pauseSchedule, triggerActor, or a webhook action. Every action supports dryRun: true to rehearse first.
How often should I schedule it? Daily for production actors (about $10.50/month per actor). Hourly for high-value pipelines (pricing, lead gen). Weekly for infrequently-updated actors (about $1.40/month per actor). Output Guard is designed for scheduled recurring use — drift detection, incident lifecycle, and trend analysis all improve with each run, so a scheduled monitor is meaningfully more valuable than one-off checks.
How do I monitor Apify actor output? Run Output Guard in monitor mode on a schedule alongside the target actor. Each run validates the latest output, compares it against a baseline (previous run, last-good, or a rolling/seasonal strategy), tracks incidents across runs, and returns a routable decision you branch on. Pair it with Apify Schedules to run daily or hourly.
How do I detect selector regressions? A broken selector usually shows up as a null-rate spike or a coverage drop while the run still succeeds. Output Guard flags these with OUTPUT_NULL_SPIKE / OUTPUT_COVERAGE_DROP and classifies the likely cause as selector_break with confidence, supporting evidence[], and counterEvidence[] — so you know it's the selector, not the source.
Why did my actor succeed but return empty fields? Run status only confirms the code ran, not that the data is correct. A selector change, an upstream API shift, or an auth/pagination failure can leave critical fields null on a SUCCEEDED run. Output Guard measures per-field null and empty rates against a baseline and returns act_now when a field that used to be populated suddenly isn't.
How do I validate scraper output before importing into a CRM? Run Output Guard on the scraper's output and branch on decision: ignore continues the import, act_now halts it before bad rows (null emails, duplicates, stale records) reach the CRM. It runs at the actor-output layer, before any ETL.
How do I compare today's actor output with yesterday's? Set referenceRunId to a known-good run (or use a previousRun / lastGood baseline). Output Guard returns a per-field referenceDiff classifying every field as better / worse / same / new / lost, so you can see exactly what changed since the run you trust.
Responsible use
- Output Guard validates the output of other Apify actors by running them with user-provided input. It does not bypass authentication, CAPTCHAs, or access restricted content.
- Users are responsible for ensuring the target actors they validate comply with applicable laws, platform terms, and data protection regulations.
- Do not use Output Guard to validate actors that access content or APIs you are not authorised to use.
- For guidance on responsible actor usage, see Apify's documentation.
Help us improve
If you encounter issues, you can help us debug faster by enabling run sharing in your Apify account:
- Go to Account Settings → Privacy.
- Enable Share runs with public Actor creators.
This lets us see your run details when something goes wrong. Your data is only visible to the actor developer, not publicly.
Support
Found a bug or have a feature request? Open an issue in the Issues tab on this actor's page. For custom solutions or enterprise integrations, reach out through the Apify platform.
Next stage
Output Guard is the runtime stage of one developer lifecycle: publish, quality, release, invocation, orchestration, runtime, migration, portfolio. Deploy Guard protects releases, before they ship. Output Guard protects live systems, after the run.
Next stage: A/B Tester. Output healthy? When you are weighing a replacement, compare two actors head-to-head for a production decision.