US Traffic Signal Locations & Intersection Dataset
Pricing
from $30.00 / 1,000 delivered intersections
US Traffic Signal Locations & Intersection Dataset
Download traffic signal locations for any US city or state — ~170k signalized intersections across 225 cities, all 50 states + DC. Signal type, ADA flags, approach count, nearest street. JSON/CSV/Excel/KML for SUMO, VISSIM, V2X. Data © OpenStreetMap contributors (ODbL 1.0).
Pricing
from $30.00 / 1,000 delivered intersections
Rating
5.0
(1)
Developer
ScholarStack
Maintained by CommunityActor stats
0
Bookmarked
3
Total users
2
Monthly active users
2 months ago
Last modified
Categories
Share
Get traffic signal locations for any US city or state in minutes. This actor extracts ~170,000 signalized intersections from OpenStreetMap across 225 cities in all 50 states + Washington, D.C. — one clean, deduplicated record per intersection, classified by signal type, with approach-arm count, ADA/accessibility flags, nearest street, and confidence score. Export as JSON, CSV, Excel, or KML for Google Earth, ready for V2X/C-ITS, traffic simulation (SUMO/VISSIM), HD maps, and routing.
Run a free dryRun first to see the exact intersection count and estimated cost before paying.
Need European coverage? Use the companion Europe Traffic Signal Locations & Intersection Dataset — same pipeline, 271 cities in 41 countries.
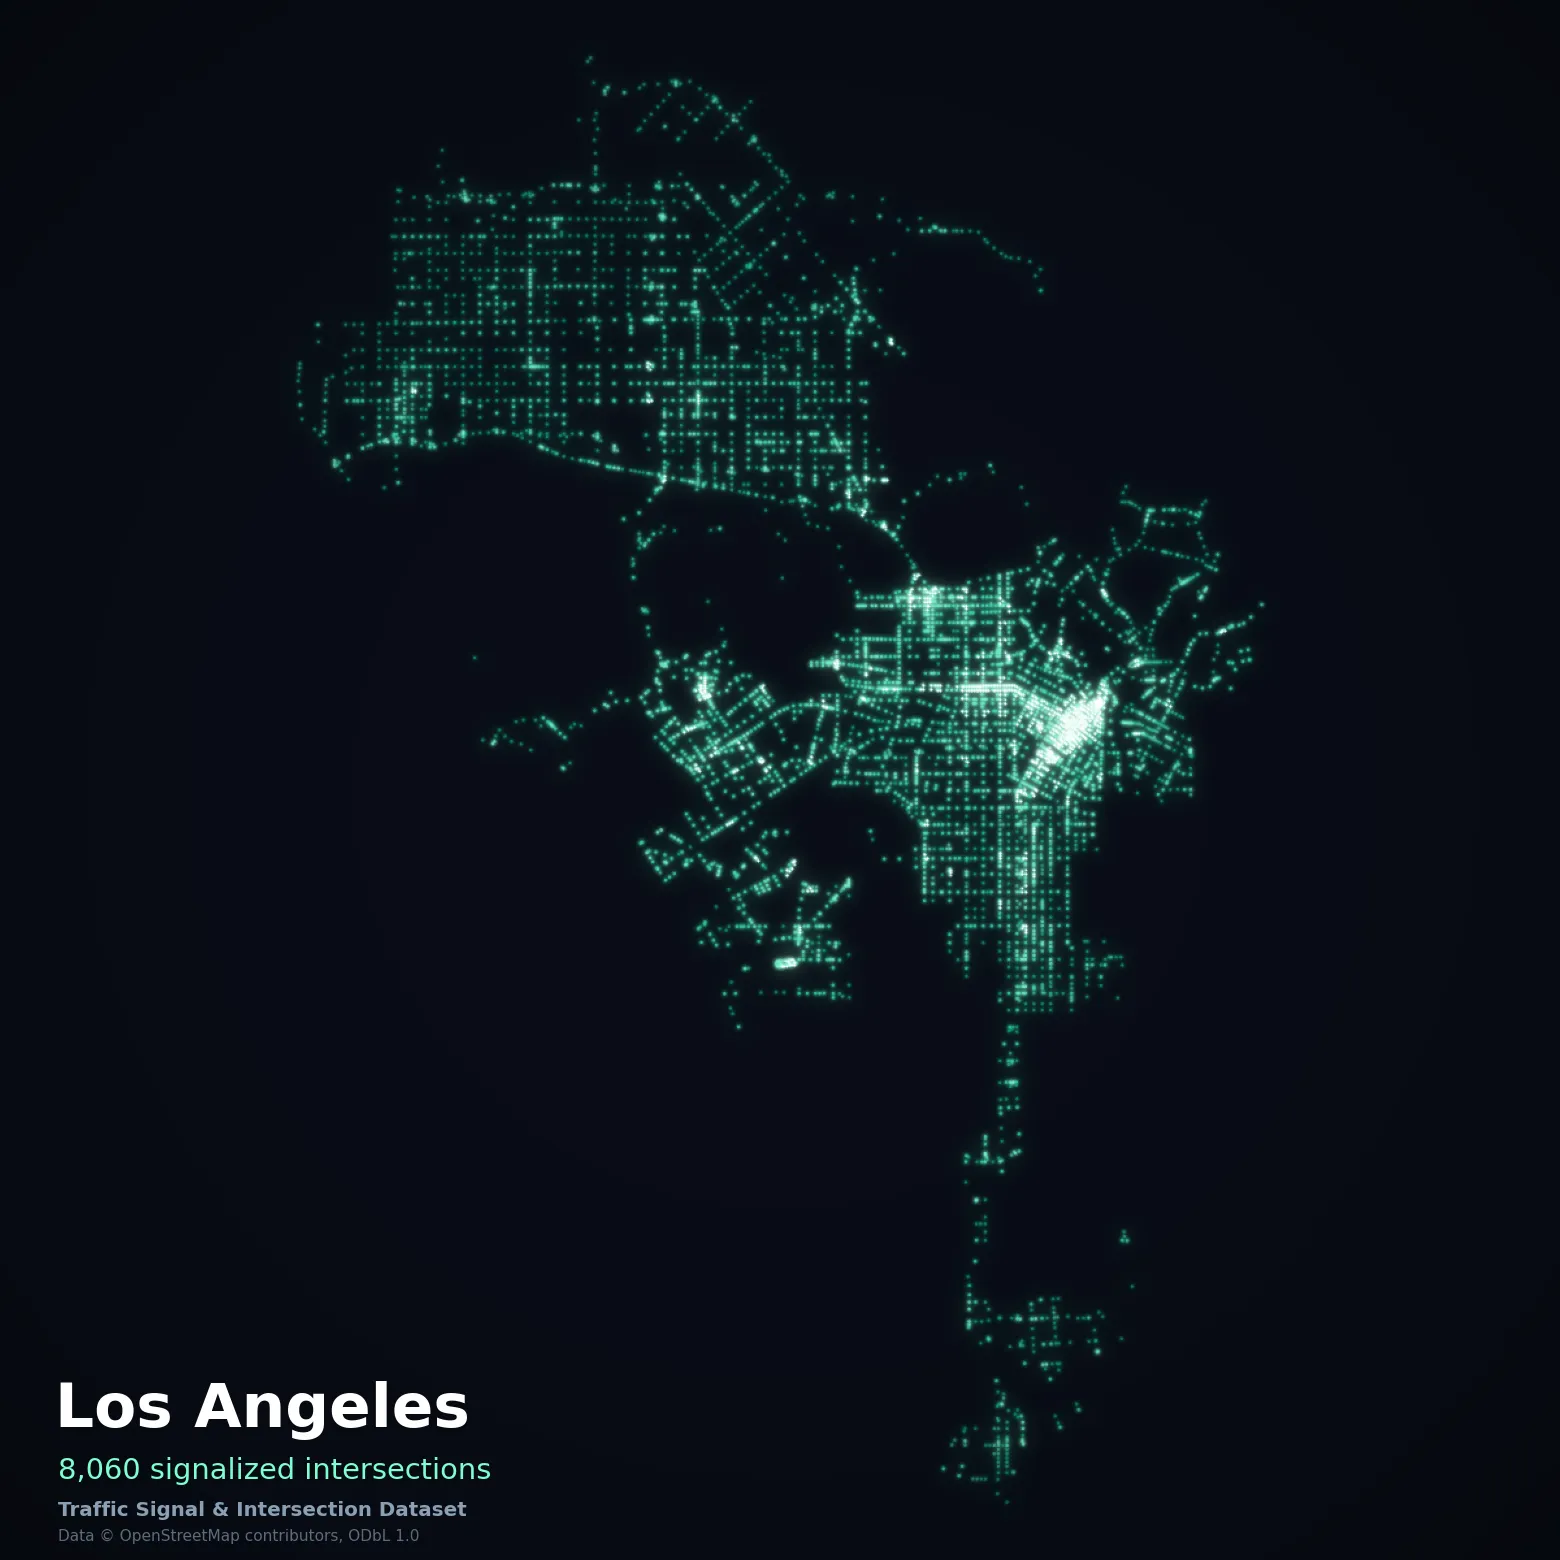
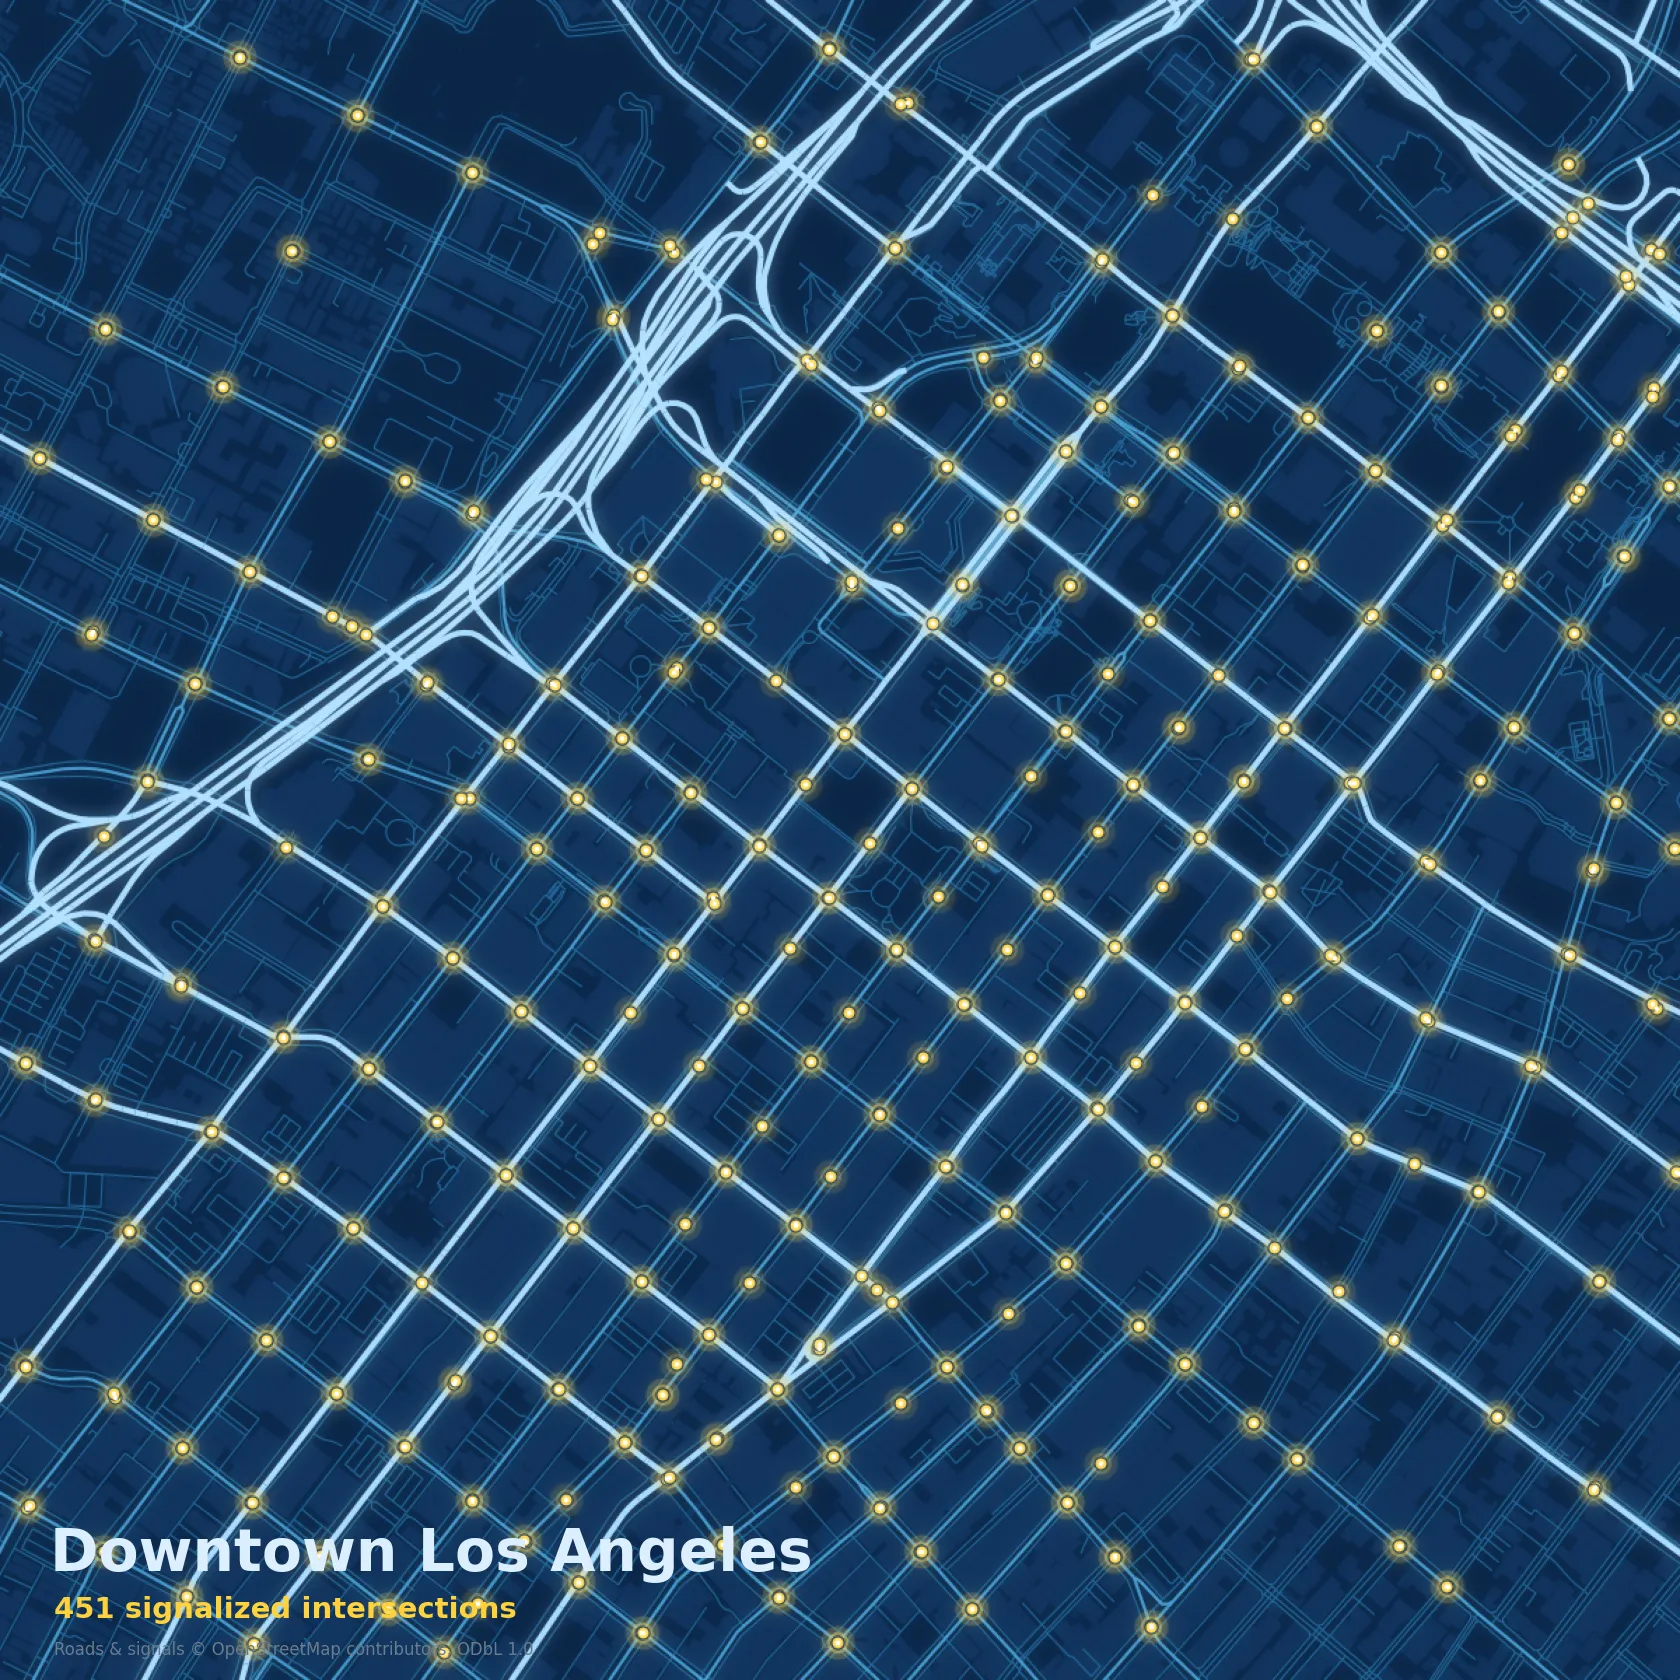
Los Angeles — full-city coverage (left) and the downtown road network with signalized intersections (right). Data © OpenStreetMap contributors, ODbL 1.0.
How to get traffic signal locations for any US city
- Click Try for free and pick an input mode:
| Mode | How | Example |
|---|---|---|
| Single city | city: "ca-socal-los_angeles" | Los Angeles only |
| Multiple cities | cities: ["wa-seattle", "ny-new_york"] | Any combination |
| Whole state | state: "WA" | All listed Washington cities |
| Custom bbox | customBbox: "34.00,-118.50,34.20,-118.20" + state: "CA-SOCAL" | Any rectangle |
- Set
dryRun: truefor a free estimate (count, cost, 10 sample records — no charge). - Run for real and download JSON, CSV, Excel, or KML from the Output tab.
What data you get for each signalized intersection
| Field | Description |
|---|---|
intersection_id | Stable, location-based ID US-{STATE}-{CITY3}-{geohash8} (e.g. US-CA-SOCAL-LOS-9q5ctr1p) |
state_code | USPS state / region code (e.g. WA, CA-NORCAL, CA-SOCAL) |
city_slug / city_name | City key and human-readable name |
lat / lon | Intersection centroid (WGS84) |
osm_id | A representative OSM node id for the intersection |
signal_type | vehicular_junction, pedestrian_crossing, vehicular_and_pedestrian, hawk_signal, or level_crossing |
approach_count | Number of road arms meeting at the junction (when available) |
nearest_street | Name of the nearest named road |
accessibility | ADA flags: button_operated, sound_signal, tactile_paving, countdown_display, vibration_signal, bicycle_signal, leading_pedestrian_interval (true/false/null) |
confidence | { "score": 0.0–1.0, "reason": ... } — Phase 1 is OSM-density based |
source_tier | osm (Phase 2 will add official+osm) |
osm_last_edited | When the signal was last edited in OSM |
data_vintage | Date of the OSM data snapshot used |
attribution | © OpenStreetMap contributors, ODbL 1.0 |
Output example
Signal types covered (vehicular, pedestrian, HAWK, level crossing)
| Value | Meaning |
|---|---|
vehicular_junction | Road junction signal (highway=traffic_signals, no crossing) |
pedestrian_crossing | Signalized pedestrian crossing (crossing=traffic_signals) |
vehicular_and_pedestrian | Junction with a pedestrian phase |
hawk_signal | HAWK pedestrian beacon (US-specific) |
level_crossing | Railway level crossing with signals |
Coverage: 225 cities, all 50 US states + DC
One major metro per state to start, with California split into NorCal and SoCal sub-regions (mirroring Geofabrik). Each region's signal data is sourced from the latest Geofabrik US-state OpenStreetMap extract. Run dryRun: true to see exact intersection counts and estimated cost for your city or state before paying.
Export traffic signals to KML / Google Earth, CSV, or Excel
Every run produces JSON and CSV; KML export gives you a Google Earth-ready file with each signalized intersection as a placemark, and Excel export is available on the dataset. KML is the fastest way to visually verify coverage for your city before integrating the data.
Using this data in SUMO, VISSIM, or V2X applications
Use lat/lon to match signalized junctions onto your SUMO or VISSIM network nodes, approach_count to sanity-check junction geometry, and signal_type to separate vehicular junctions from pedestrian crossings. For V2X/C-ITS work, the stable geohash-based intersection_id provides a persistent key for RSU placement planning and MAP/SPaT inventories across data refreshes. The ADA accessibility flags support pedestrian-accessibility audits and inclusive-routing applications.
Key parameters
signalType(default["all"]) — array; pick any taxonomy values orall.minConfidence(default0) — integer 0–100 (interpreted as 0.00–1.00); drops intersections below it.includeAccessibility(defaulttrue) — include the ADA flags block.clusterRadiusMeters(default70) — signals within this radius group into one intersection.mergeRadiusMeters(default70) — centroids within this radius merge (fixes divided-road duplicates).maxResults(default1000) — cap delivered/charged intersections.0= unlimited.dryRun(defaultfalse) — free estimate: count, cost, 10 sample records. No charge.priorDatasetId— Delta Mode; pass a previous run'sdefaultDatasetIdto be charged only for added/removed/changed intersections.
How much does it cost to extract traffic signal data?
$0.03 per delivered intersection ($30 per 1,000), plus $0.25 per run for KML export. Always run dryRun: true first to see the exact count and cost. For recurring refreshes, Delta Mode charges only for intersections that were added, removed, or changed since your last run — combined with Apify's scheduler, that turns this actor into a monthly traffic signal change-monitoring feed for your city or state.
Data accuracy vs official city figures
Vehicular signalized-intersection counts from this actor track the figures published by city transportation departments within a few percent:
| City | Official DOT figure | This actor (vehicular only) | Difference |
|---|---|---|---|
| Los Angeles | ~4,850 (LADOT) | 4,856 | 0% |
| New York City | ~13,770 (NYC DOT) | 13,198 | −4% |
| Chicago | ~2,900 (CDOT) | 2,988 | +3% |
The default signalType: ["all"] additionally includes standalone pedestrian-crossing signals, so the all-types total per city is higher than the vehicular-only figure above. Set signalType: ["vehicular_junction", "vehicular_and_pedestrian"] to match a DOT's vehicular-intersection count.
Data quality, confidence scores, and OSM attribution
- Data comes from OpenStreetMap (ODbL 1.0). Coverage and accuracy depend on OSM contributor activity in each city.
confidence.scorereflects OSM density for the city (Phase 1). Phase 2 will fuse official city open-data and raise confidence where the two agree.osm_last_editedis included per intersection so you can judge freshness yourself.- Data is refreshed periodically from the latest Geofabrik US-state extracts.
Data © OpenStreetMap contributors, available under the Open Database License (ODbL 1.0). Any use of this data must credit OpenStreetMap contributors and comply with ODbL terms. Note for downstream use: datasets you build from this data are Derivative Databases under the ODbL — if you use them publicly, they must remain available under ODbL terms with OpenStreetMap attribution. Internal/private use carries no share-alike obligation.
Disclaimer
This is an independent, unofficial tool built on publicly available OpenStreetMap data. It is not affiliated with or endorsed by the OpenStreetMap Foundation, Geofabrik, Google (Google Earth), the Eclipse Foundation (SUMO), or PTV Group (VISSIM). Product names are used solely to indicate data-format compatibility.
FAQ
Where can I download traffic signal locations for a US city?
Run this actor with your city key (e.g. wa-seattle) and download every signalized intersection as JSON, CSV, Excel, or KML in minutes — no GIS tooling required. All 225 covered cities and 50 states work the same way.
Does OpenStreetMap have traffic signal data?
Yes — OSM maps signals as highway=traffic_signals and crossing=traffic_signals nodes, but raw nodes include multiple poles per junction. This actor clusters and deduplicates them into one record per real intersection, classified by signal type including US-specific HAWK beacons.
Can I get pedestrian signal and ADA accessibility data?
Yes — each record carries ADA flags (audible signals, tactile paving, push buttons, countdown displays, leading pedestrian intervals and more) where OSM contributors have mapped them.
Can I get the data as KML for Google Earth?
Yes — KML export ($0.25 per run) produces a Google Earth-ready file of all delivered intersections.
Can I monitor a city for new or changed signals?
Yes — Delta Mode (priorDatasetId) returns and charges only for added, removed, or changed intersections since your previous run. Schedule it monthly for a continuous change feed.
How is this different from the Europe version?
Same pipeline and schema family, different coverage: this actor covers 225 US cities across all 50 states with ADA/accessibility flags and the US signal taxonomy (incl. HAWK beacons); the Europe actor covers 271 cities in 41 countries.