
Data to PDF Report Generator
Pricing
Pay per usage
Go to Apify Store
Data to PDF Report Generator
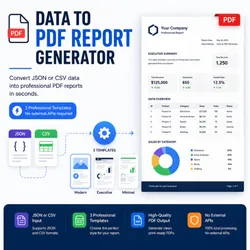
Convert JSON or CSV data into a professional PDF report with 3 templates. No external APIs required. Supports tables, charts, headers and custom branding. Free plan ready.
Pricing
Pay per usage
Rating
0.0
(0)
Developer
Proyecto Apify
Maintained by CommunityActor stats
0
Bookmarked
2
Total users
1
Monthly active users
2 months ago
Last modified
Categories
Share
Data-to-PDF Report Generator
Convert JSON or CSV data into a professional, ready-to-share PDF report. No external APIs, no code to touch.
How it works
- Select the data source: paste JSON or CSV, provide a URL, or reference a Dataset from another Apify Actor.
- Pick a template: simple table, table with bar chart, or executive summary with KPIs.
- Customize brand color and logo (optional).
- Run the Actor and download the PDF from the Key-Value Store.
Input
| Field | Type | Default | Description |
|---|---|---|---|
dataSource | string | direct_json | direct_json, direct_csv, url, or apify_dataset |
dataContent | string | "" | JSON or CSV pasted directly |
dataUrl | string | "" | URL to a JSON or CSV file |
datasetId | string | "" | ID of an Apify Dataset |
reportTitle | string | "Data Report" | PDF title |
template | string | table_with_chart | simple_table, table_with_chart, or executive_summary |
brandColor | string | "#1a73e8" | Brand color in hex |
logoUrl | string | "" | Image URL for the logo |
pageSize | string | "A4" | Letter or A4 |
Example input (JSON)
Example input (CSV)
Output
The Actor emits one record to the output Dataset:
| Field | Description |
|---|---|
status | "success" or "error" |
pdfUrl | Public URL to download the PDF |
fileName | Generated PDF file name |
rows | Number of processed rows |
columns | Number of detected columns |
generatedAt | ISO timestamp of generation |
Example output
Available templates
- Simple table: Clean table with all rows and columns. Ideal for straightforward tabular data.
- Table + Bar chart: Full table plus a Chart.js bar chart for the first numeric column detected (bundled locally, no CDN).
- Executive summary with KPIs: Cards showing total, sums, averages, min, max, and unique values, followed by a table with the first 25 rows.
Technical notes
- No external API keys or cloud services required.
- Chart.js is installed as a local dependency and embedded inline in the HTML (no CDN dependency).
- PDF is rendered with Puppeteer (
page.pdf()) directly inside the Actor. - Stored in the Key-Value Store with its public URL returned in the Dataset.
- Supports up to 10,000 records from Apify Datasets (automatic pagination).


