
French Rental Yield – Rent vs Price by Commune (DVF + Rent Map)
Pricing
from $5.00 / 1,000 yield rows
French Rental Yield – Rent vs Price by Commune (DVF + Rent Map)
Gross and net rental yield of every French commune and Paris, Lyon and Marseille arrondissement: official asking rents (ANIL rent map 2025) against real sale prices (DVF), price trend, department rankings and a yield simulation for your own property.
Pricing
from $5.00 / 1,000 yield rows
Rating
5.0
(48)
Developer

yck
Maintained by CommunityActor stats
0
Bookmarked
21
Total users
0
Monthly active users
2 days ago
Last modified
Categories
Features
Share
What does French Rental Yield do? It tells you where buy-to-let pays in France. For any commune — and every arrondissement of Paris, Lyon and Marseille — it compares the official asking rent per m² (ANIL / Ministry of Housing rent map, 2025 edition) with the real median sale price per m² from notarial deeds (DVF, up to June 2026), and returns the gross yield, an estimated net yield, the price-to-rent ratio and the price trend.
- Gross and net rental yield per commune and property type: apartments, 1–2 room apartments, 3+ room apartments, houses.
- Department rankings: give
42or59and get every commune with enough sales, best yield first. - Simulate your own property: price, surface and commune → estimated rent, yield and how your price per m² compares with the market.
- Honest numbers: medians from thousands of real sales, rent prediction intervals, sale counts, a reliability flag, and no yield when data is too thin.
- Price trend: last 12 months vs the 12 months before.
What data can you get?
| 📈 Gross yield | 💶 Net yield estimate | ⏱️ Price-to-rent years |
| 🏷️ Median price €/m² | 📊 Price quartiles | 🔁 12-month trend |
| 🏠 Rent €/m² | ↔️ Rent interval | 🧮 Sales count |
| ✅ Reliability | 🗺️ Arrondissements | 🧾 Property simulation |
How to use it
- Click Try for free and open the Actor.
- Enter communes or a department to rank.
- Choose property types and your costs assumption.
- Click Start and sort by gross yield.
- Export, or add your own property for a simulation.
Input examples
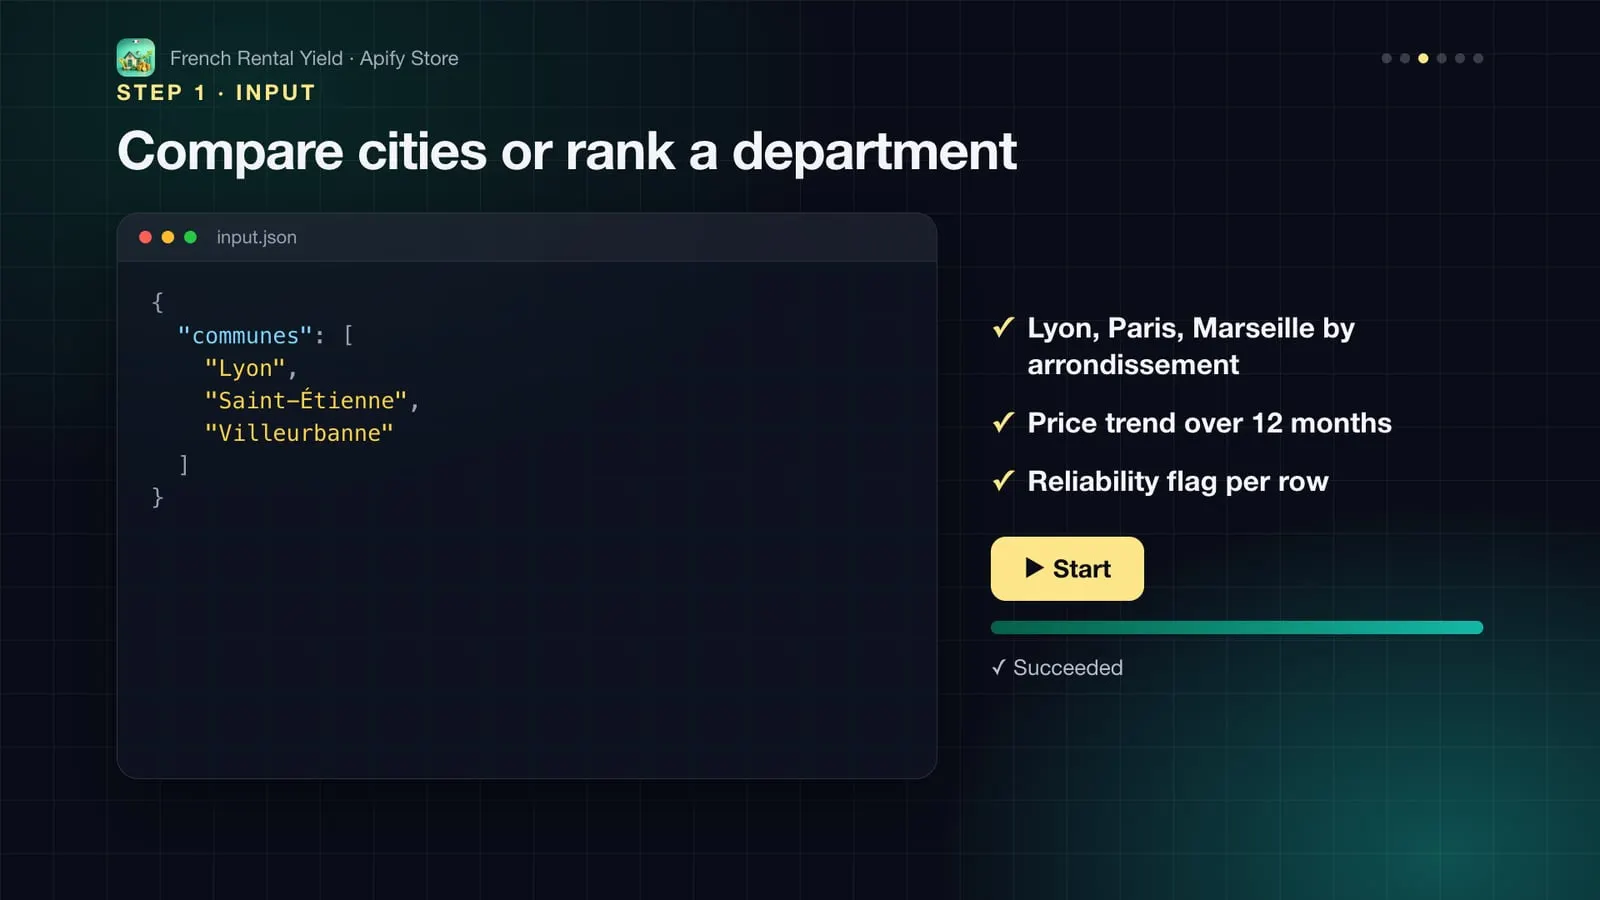
Compare a few cities (Lyon is split into its 9 arrondissements)
Best-yield apartment towns in the Loire department
Is this €250,000, 55 m² flat in Lyon 3e a good investment?
Postal codes and names both work; INSEE codes are written insee:69123.
Output
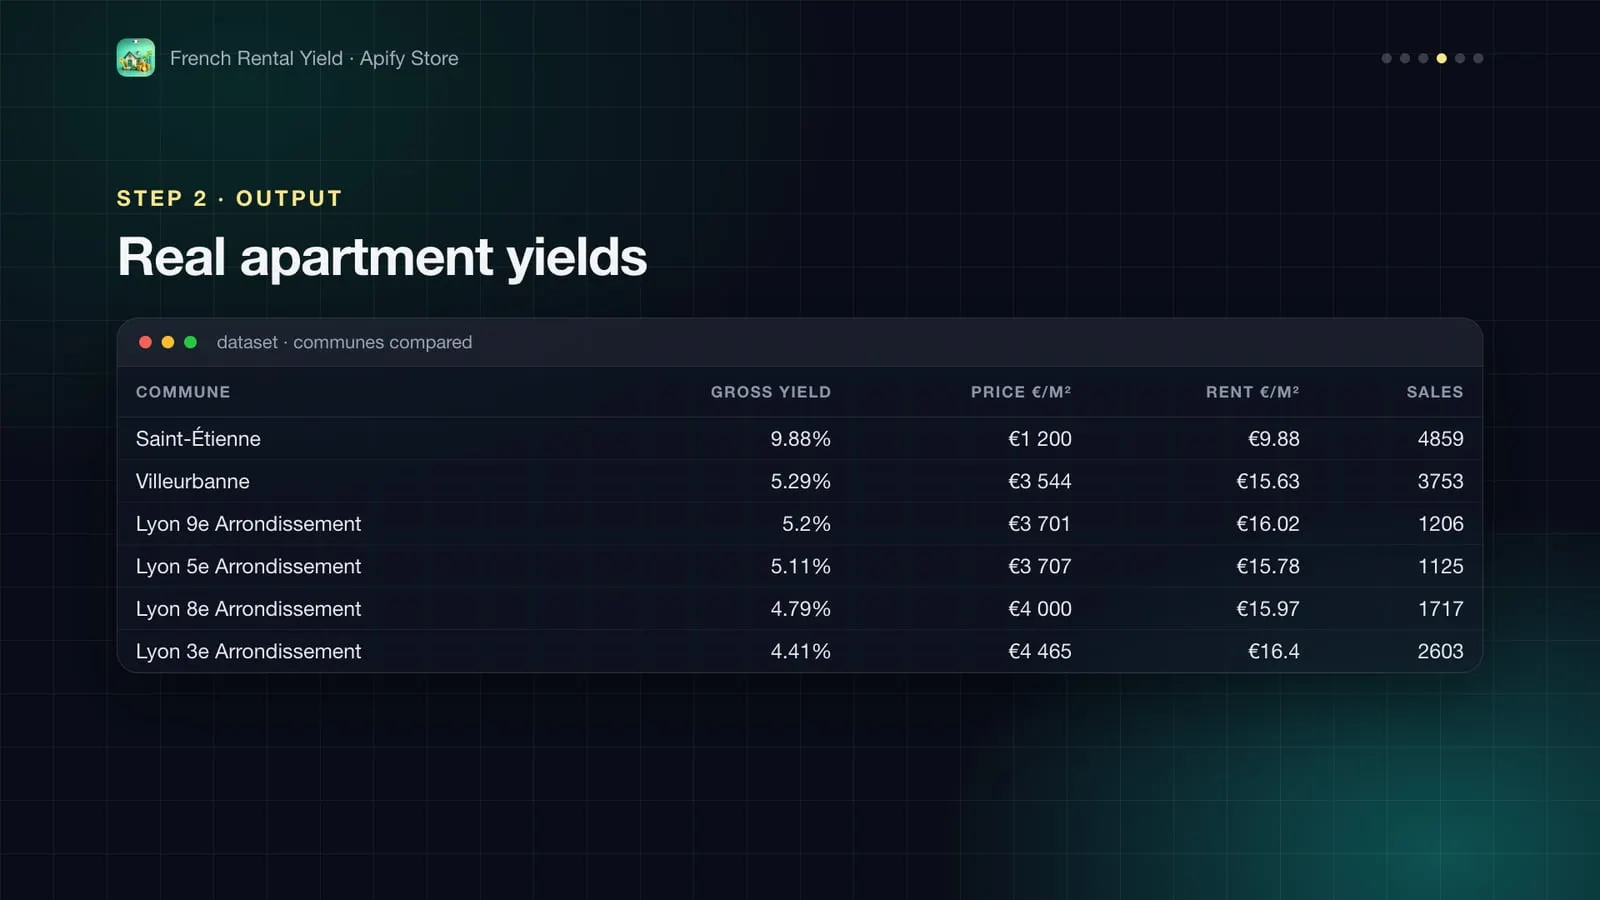
Real results from the first example (November 2026, apartments, sales July 2024 – June 2026):
| Commune | Gross yield | Net yield (est.) | Price €/m² | Rent €/m²/month | Sales |
|---|---|---|---|---|---|
| Saint-Étienne | 9.88% | 7.41% | 1,200 | 9.88 | 4,859 |
| Villeurbanne | 5.29% | 3.97% | 3,544 | 15.63 | 3,753 |
| Lyon 9e | 5.20% | 3.90% | 3,701 | 16.02 | 1,206 |
| Lyon 3e | 4.41% | 3.31% | 4,465 | 16.40 | 2,603 |
| Lyon 1er | 4.21% | 3.16% | 4,861 | 17.06 | 797 |
The property simulation for the third example returns: estimated rent €902/month, gross yield 4.33%, and a price per m² 1.8% above the Lyon 3e median.
| Field | Meaning |
|---|---|
grossYieldPercent | Annual rent ÷ purchase price: rentPerM2 × 12 ÷ medianPricePerM2. |
netYieldEstimatePercent | Gross yield minus costsPercent (default 25%: property tax, non-recoverable charges, insurance, management, vacancy). Before income tax and loan costs. |
priceToRentYears | Years of rent needed to pay the price. |
medianPricePerM2 / pricePerM2Q1 / pricePerM2Q3 | Median and quartiles of DVF sales of single dwellings of that type over the period. |
rentPerM2 / rentPerM2Low / rentPerM2High | Asking rent incl. charges and its 95% prediction interval from the rent map. |
rentEstimateLevel | commune (estimated from the commune's own listings), or maille / epci (from neighbouring communes: less precise). |
reliability | high, medium or low, from the number of sales and how the rent was estimated. |
How much does it cost?
$5 per 1,000 rows ($0.005 per commune and property type, or per property simulation). Ranking a whole department typically costs between $0.20 and $2.
More Actors from this developer
| 🏠 French Property Sale Prices (DVF) Every French property sale, €/m² and valuations | 🌊 French Natural & Industrial Risks Flood, clay, seismic and industrial risks per address | 🏫 French Schools French schools with IPS and exam value added |
| 🗺️ French Cadastre Parcels Parcel area, PLU zoning, constraints and past sales | ⚡ French Energy Ratings (DPE) French DPE energy ratings by address or area | 🏗️ French Building Permits French building permits with developer and SIREN |
FAQ
Where do the numbers come from?
Rents: the official carte des loyers published by the Ministry of Housing with ANIL (asking rents from online listings, model-based per commune, 2025 edition). Prices: DVF, every property sale recorded by the French tax administration, refreshed by this Actor's data pipeline after each semi-annual release. Alsace-Moselle (57, 67, 68) and Mayotte have no DVF data.
Why can the yield of small towns look very high?
Cheap towns often have high gross yields, but also more vacancy and less demand. Check salesCount, reliability, the price trend and the rent interval, and raise costsPercent for riskier markets.
Are rents including charges?
Yes: the rent map gives asking rents including charges for a typical unit (about 52 m² for apartments, 92 m² for houses). Real signed rents can be a few percent lower.
Can I get the underlying sales?
Use French Property Prices (DVF) from the same developer to list every sale, with addresses and surfaces.
Can I use it through the API, Make, Zapier or Google Sheets?
Yes. Every run can be started and read through the Apify API (JavaScript and Python clients, CLI, MCP), and Apify integrations connect it to Make, Zapier, n8n, Google Sheets, Slack, webhooks and more.
Is it legal to use this data?
The Actor only reads public or official open data and doesn't log in anywhere. Check the source's licence and your local rules (for example GDPR when data concerns people) for your use case; if in doubt, ask a lawyer.
Something isn't working, or you need another field?
Open an issue on the Issues tab: feedback is read and answered.


