Finance Monitor AI Agent avatar
Finance Monitor AI Agent

Pricing

Pay per event

Go to Store
Finance Monitor AI Agent

Finance Monitor AI Agent

Developed by

harvest-org

Maintained by Community

Generates market reports based on user queries. By inputting a search query such as "How is Microsoft doing this week?", the actor fetches relevant financial data, analyzes it, and produces a structured market summary.

0.0 (0)

Pricing

Pay per event

0

Monthly users

1

Runs succeeded

>99%

Last modified

a month ago

AI Finance Monitor - Apify Actor

Overview

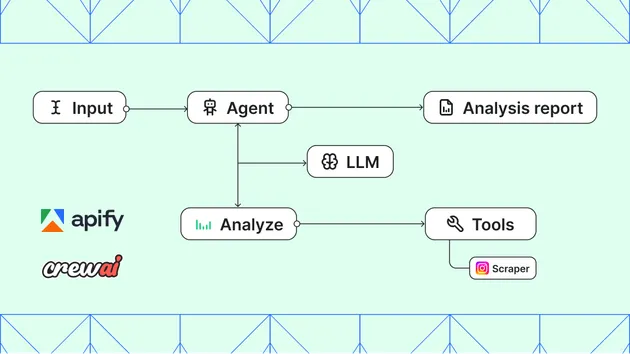
The AI Finance Monitor is an Apify Actor designed to generate market reports based on user queries. By inputting a search query such as "How is Microsoft doing this week?", the actor fetches relevant financial data, analyzes it, and produces a structured market summary.

Features

  • Market Summary: Provides a high-level overview of stock performance.
  • Price Movement: Includes starting and closing prices, percentage changes, and trading volume.
  • Key Headlines: Fetches and summarizes the latest news related to the searched company.
  • Market Metrics: Reports important financial metrics like market capitalization, P/E ratio, and beta.
  • Automated Report Generation: Outputs a structured summary in a user-friendly format.

Input

The actor takes a single search query as input:

1{
2    "OPENAI_API_KEY": "", //optional
3    "researchRequest": "How is microsoft doing this week?"
4}

Output

Be sure to check the "Storage > Key-value store output tab for the HTML/MD report files.

The actor produces two outputs:

  • JSON data output of the raw data
  • HTML human-readable report

Html Output

Sample HTML Report

JSON Output

The output is a JSON object containing:

1{
2		"results": {
3			"price": {
4				"regularMarketPrice": 388.56,
5				"previousClose": 378.77,
6				"dayLow": 379.51,
7				"dayHigh": 389.79,
8				"open": 379.92,
9				"volume": 19749136,
10				"marketCap": 2888547172352,
11				"trailingPE": 31.34,
12				"forwardPE": 25.99,
13				"dividendRate": 3.32,
14				"dividendYield": 0.0085,
15				"exDividendDate": "2025-05-15",
16				"fiftyTwoWeekLow": 376.91,
17				"fiftyTwoWeekHigh": 468.35
18			},
19			"summaryDetail": {
20				"shortName": "Microsoft Corporation",
21				"longName": "Microsoft Corporation",
22				"currency": "USD",
23				"beta": 0.914
24			}
25		},
26		"chart": {
27			"meta": {
28				"currency": "USD",
29				"symbol": "MSFT",
30				"exchangeName": "NMS",
31				"fullExchangeName": "NasdaqGS",
32				"instrumentType": "EQUITY",
33				"firstTradeDate": "1986-03-13T14:30:00.000Z",
34				"regularMarketTime": "2025-03-14T20:00:01.000Z",
35				"hasPrePostMarketData": true
36			},
37			"quotes": [
38				{
39					"date": "2025-03-10T13:30:00.000Z",
40					"high": 386.39,
41					"low": 377.22,
42					"open": 385.84,
43					"close": 380.16,
44					"volume": 32840100
45				},
46				{
47					"date": "2025-03-11T13:30:00.000Z",
48					"high": 386,
49					"low": 376.91,
50					"open": 379,
51					"close": 380.45,
52					"volume": 30380200
53				},
54				{
55					"date": "2025-03-12T13:30:00.000Z",
56					"high": 385.22,
57					"low": 378.95,
58					"open": 382.95,
59					"close": 383.27,
60					"volume": 24253600
61				},
62				{
63					"date": "2025-03-13T13:30:00.000Z",
64					"high": 385.32,
65					"low": 377.45,
66					"open": 383.16,
67					"close": 378.77,
68					"volume": 20473000
69				},
70				{
71					"date": "2025-03-14T13:30:00.000Z",
72					"high": 390.23,
73					"low": 379.51,
74					"open": 379.78,
75					"close": 388.56,
76					"volume": 19929300
77				}
78			],
79			"events": {
80				"dividends": [
81					{
82						"date": 1684108800,
83						"amount": 3.32
84					}
85				]
86			},
87			"priceHint": 2
88		},
89		"news": [
90			{
91				"uuid": "a779f012-c27d-35ae-a9e9-29dd5c5ee6b4",
92				"title": "Is Microsoft Corp. (MSFT) the Best QQQ Stock to Invest in Now?",
93				"publisher": "Insider Monkey",
94				"link": "https://finance.yahoo.com/news/microsoft-corp-msft-best-qqq-025150139.html",
95				"providerPublishTime": "2025-03-16T02:51:50.000Z",
96				"type": "STORY",
97				"thumbnail": {
98					"resolutions": [
99						{
100							"url": "https://s.yimg.com/uu/api/res/1.2/FPV7LMJx9t7xViBmxMrZWw--~B/aD04MTY7dz0xNDU2O2FwcGlkPXl0YWNoeW9u/https://media.zenfs.com/en/insidermonkey.com/ae3cb2a93ad8e5ddf6f94148e71f74b9",
101							"width": 1456,
102							"height": 816,
103							"tag": "original"
104						},
105						{
106							"url": "https://s.yimg.com/uu/api/res/1.2/snE9DwM_Mhbq41k5r0NVHA--~B/Zmk9ZmlsbDtoPTE0MDtweW9mZj0wO3c9MTQwO2FwcGlkPXl0YWNoeW9u/https://media.zenfs.com/en/insidermonkey.com/ae3cb2a93ad8e5ddf6f94148e71f74b9",
107							"width": 140,
108							"height": 140,
109							"tag": "140x140"
110						}
111					]
112				}
113			}
114		]
115}

Usage

  1. Deploy the actor on Apify.
  2. Provide a search query as input.
  3. The actor retrieves, processes, and returns a structured market summary.

Limitations

  • Some financial data may be unavailable or labeled as "undefined" if not accessible at runtime.
  • News headlines are fetched from external sources and may vary in availability.

Future Enhancements

  • Improve data accuracy by integrating with multiple financial APIs.
  • Support for historical comparisons and trend analysis.
  • Extend coverage to cryptocurrencies and commodities.

License

This project is licensed under the MIT License.

Pricing

Pricing model

Pay per event 

This Actor is paid per event. You are not charged for the Apify platform usage, but only a fixed price for specific events.

Actor initialization

$1.000

Starting of the actor

LLM Input

$0.010

Length of input query (only for users who do not supply an API key)