SERP
Pricing
$5.55/month + usage
Go to Apify Store Deprecated
SERP
Images are considered as a valuable field of Google Search Engine Results Page (SERP) and always added to Dataset if any.
Pricing
$5.55/month + usage
Rating
0.0
(0)
Developer
Yuriy Chistyakov
Maintained by Community
Actor stats
0
Bookmarked
1
Total users
1
Monthly active users
2 years ago
Last modified
Categories
Share
How it works
This code is a JavaScript script that uses Cheerio to scrape data from Google Search Engine Results Pages.
- The crawler starts with startUrl
https://www.google.com/search?q=${q}&start=0&${num}&lr=lang_en&hl=enwhere "q" and "num" parameters provided from the inputqandnumfields defined by the input schema. Any spaces in theqfield being encoded to plus(+) automatically. - The crawler uses
requestHandlerfor each URL to extract the data from the page with the Cheerio library and, while the results array is not empty, saves the url, pageTitle and results of each page to the Dataset, otherwise Actor exits. Every result in array consists of site, link, title, description, image. After the data has been saved, the crawler enqueues request to the next page with the "start" parameter increased by the value of "num". - Number of scraped pages is limited by
Max Requests per Crawlfield from the input schema. It also logs out the url of each page visited.
Included features
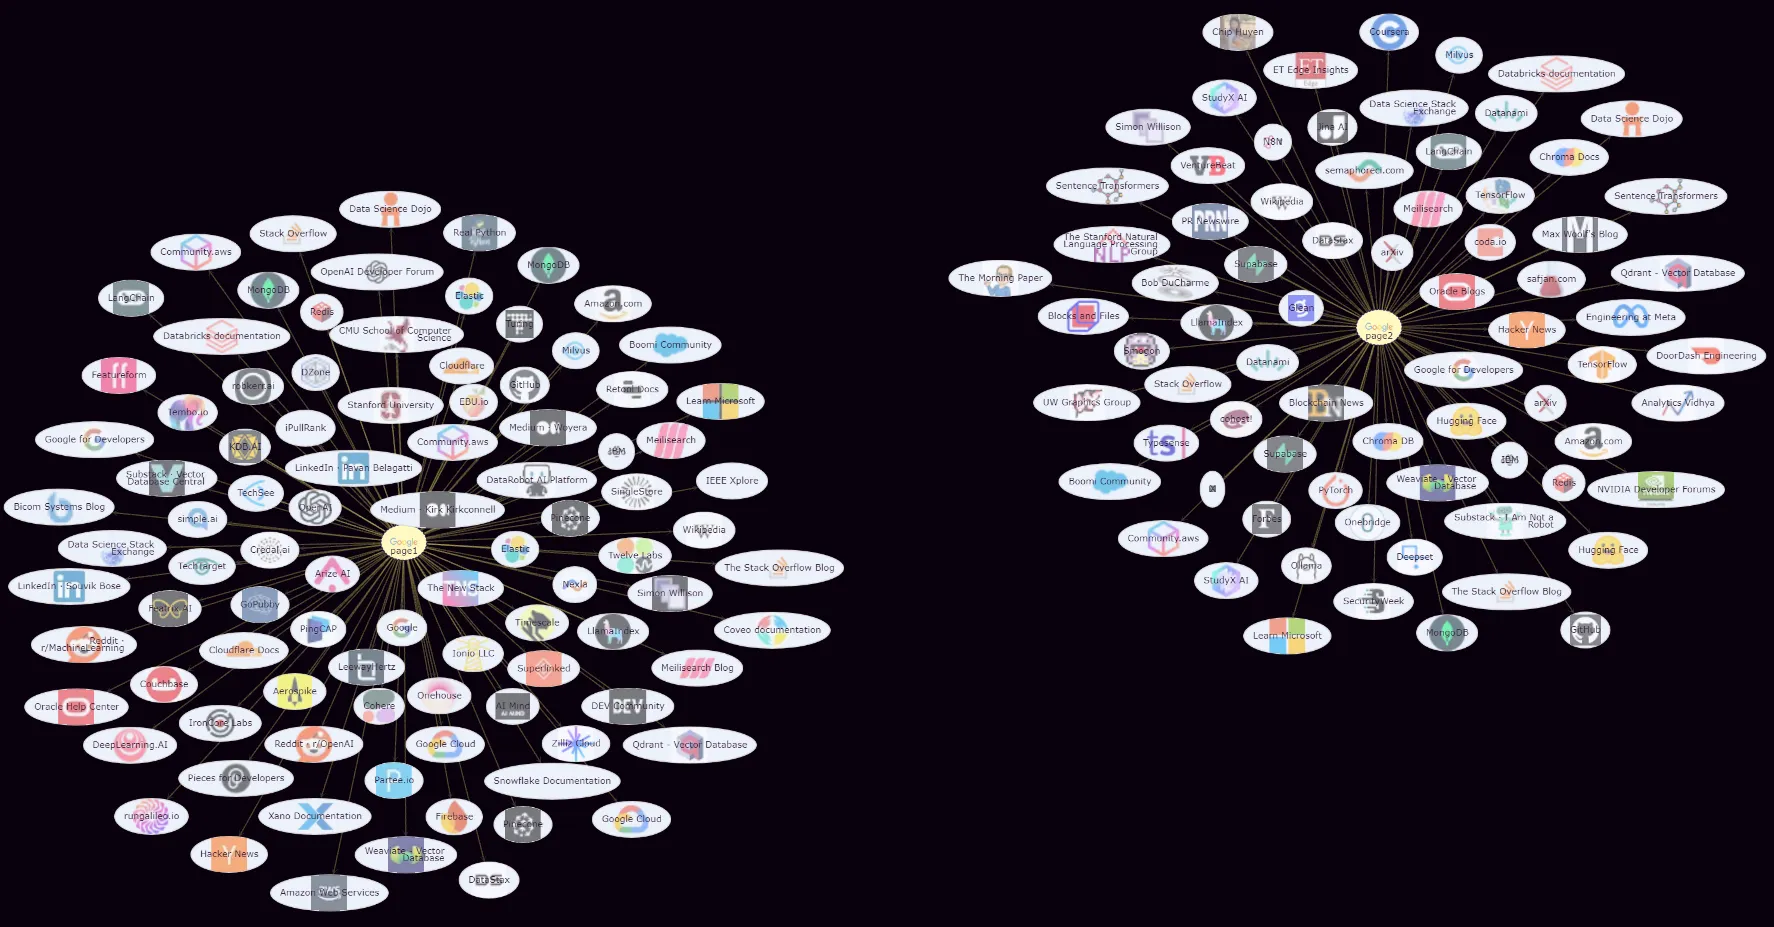
Let's take a closer look at how it works using serpifier
- By entering a search query and leaving the
numandmaxRequestsPerCrawlparameters unchanged, we get the following graph:
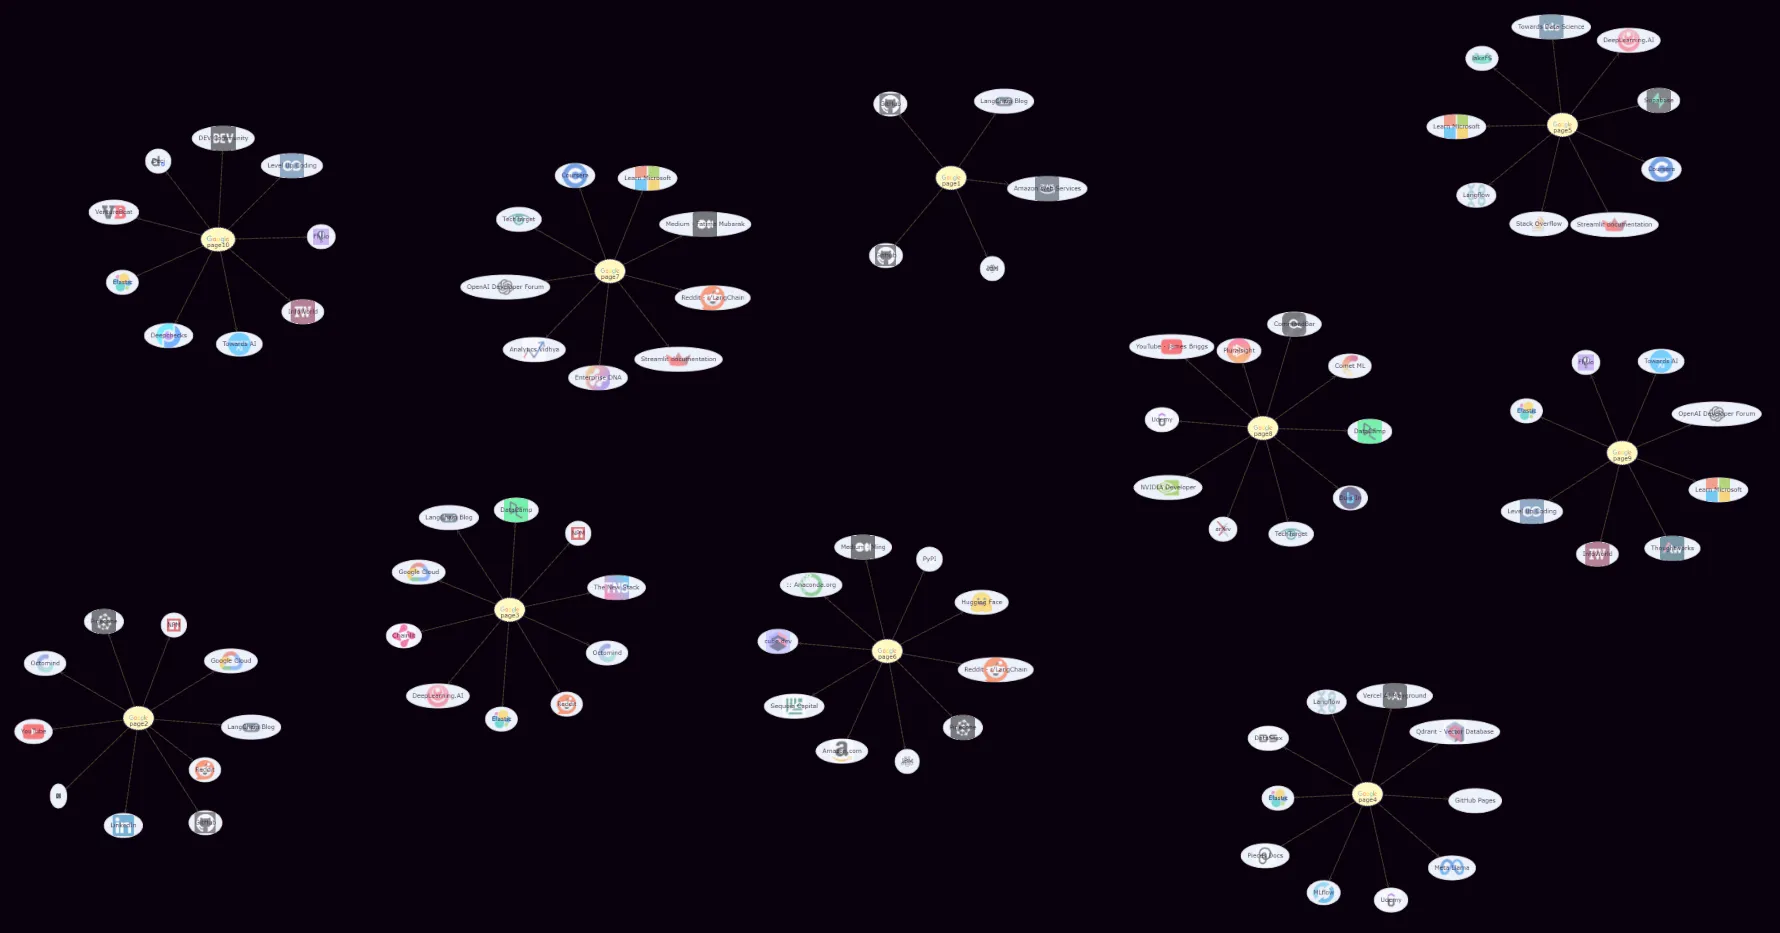
- Now let's limit the number of results by setting
numto 10 andmaxRequestsPerCrawlto 10. That is, 10 pages with a maximum of 10 results per page:
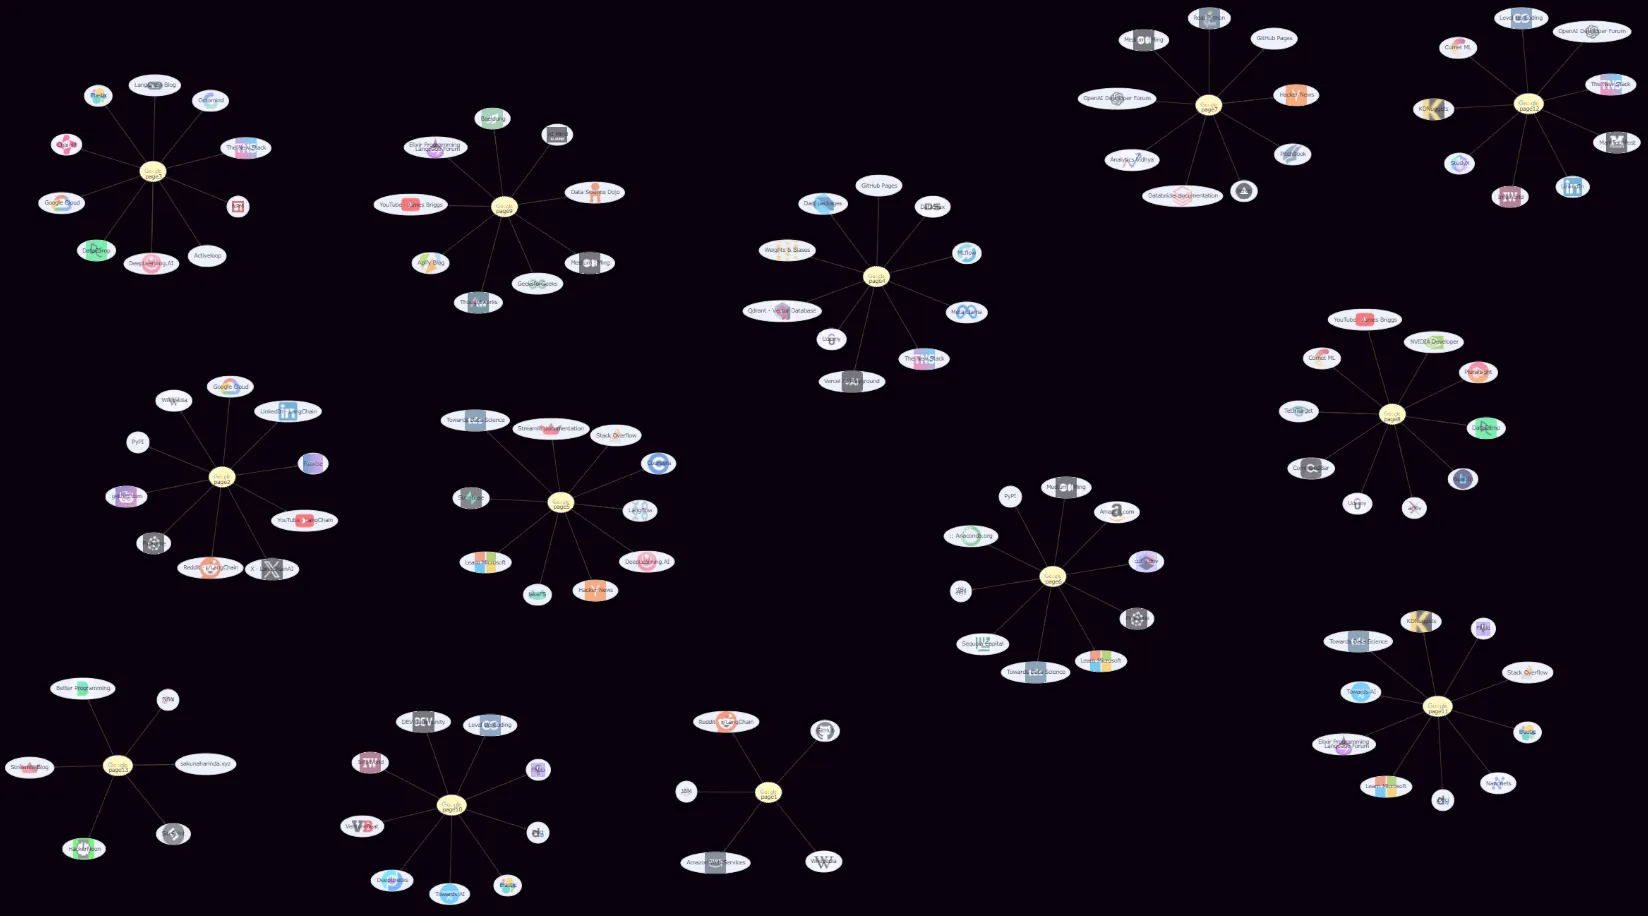
- And here is the result with the
maxRequestsPerCrawlset to 20. The graph will look something like this:
 In fact, we don’t know the number of search results in advance, so we’re just playing with the parameters.
- Curious, how looks the graph with
num: 2 andmaxRequestsPerCrawl: 100?
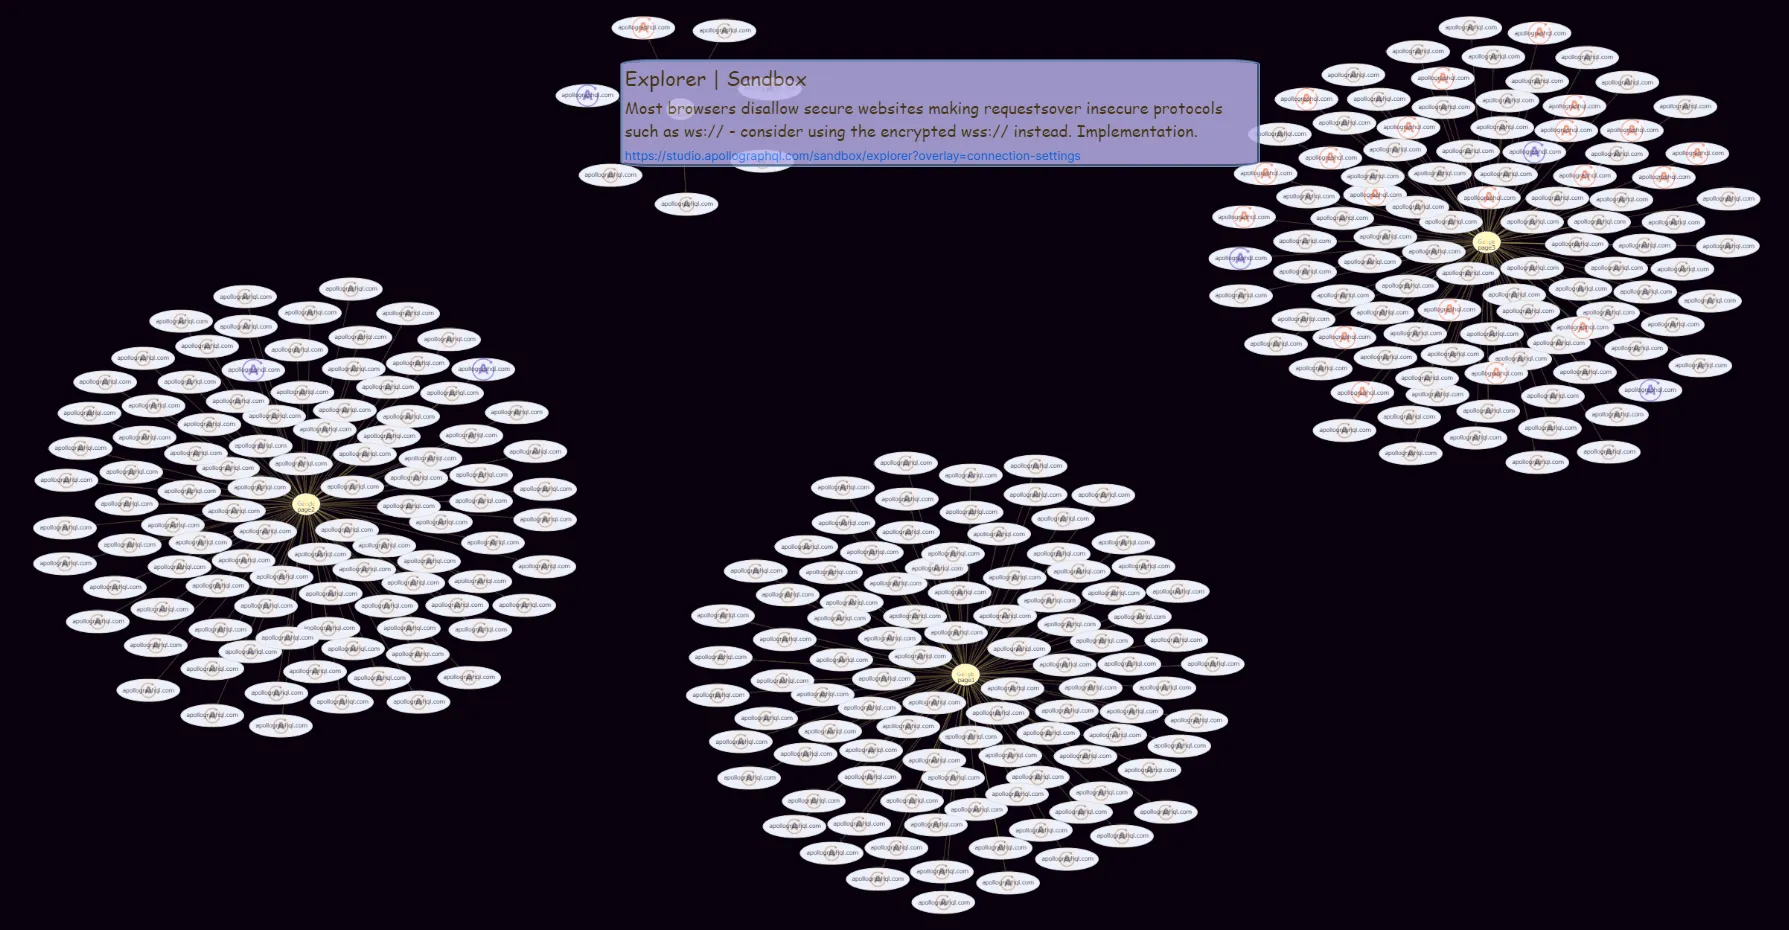
- By setting a
sitesearchinput parameter to "apollographql.com", we will get a graph similar to the one shown below: