

Page Speed Analyzer — Lighthouse & Core Web Vitals
Pricing
from $100.00 / 1,000 page speed reports
Page Speed Analyzer — Lighthouse & Core Web Vitals
Run Google Lighthouse audits at scale — Core Web Vitals, performance scores, SEO analysis. Track site speed across all pages. No API key. Pay per record.
Pricing
from $100.00 / 1,000 page speed reports
Rating
0.0
(0)
Developer

NexGenData
Maintained by CommunityActor stats
0
Bookmarked
138
Total users
10
Monthly active users
2 days ago
Last modified
Share
⚡ Page Speed Analyzer — Lighthouse & Web Vitals scores for any URL, one page or a whole list
Get Google's official Lighthouse performance score and Core Web Vitals (LCP, FCP, TBT, CLS, Speed Index, Time to Interactive) for any public web page, as clean JSON you can put in a spreadsheet, a dashboard, a client report or an agent workflow. The audit runs on Google's PageSpeed Insights infrastructure, so the numbers are the same ones Google Search Console and PageSpeed Insights show — not a local emulation that drifts with server load.
Built for SEO and CRO consultants who report on client sites, agencies that audit prospects before a pitch, developers who want a performance regression check on every deploy, and anyone who is tired of pasting URLs into the PageSpeed Insights page one at a time. Send one url for a single report, or a urls list to score every page in one run — one record per page, priced per report delivered.
Unit of output: one report per URL. Pay-per-event: $0.10 per report plus a negligible start fee; two optional add-ons at $0.02 each. A page that cannot be reached is not charged.
📊 Sample Output
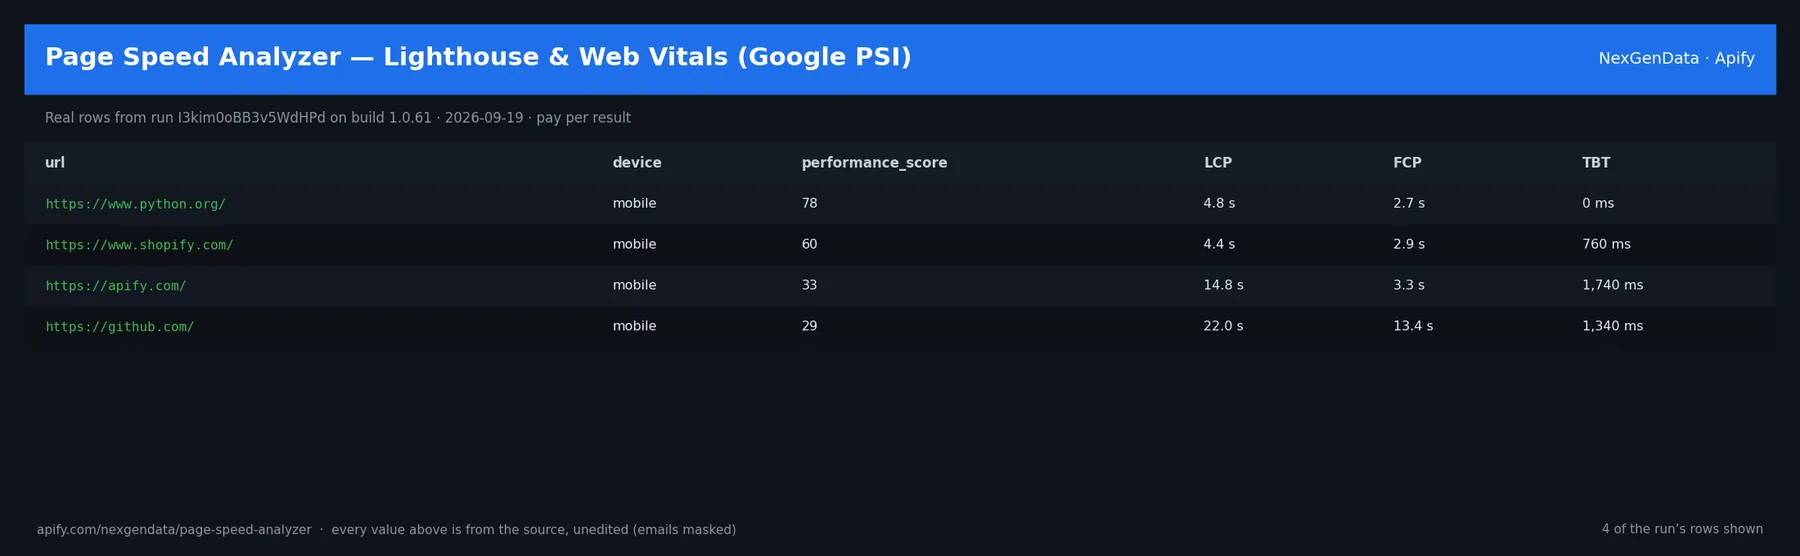
Real rows from a bulk run made for this README on 2026-09-19 (run I3kim0oBB3v5WdHPd, build 1.0.61, mobile strategy, PERFORMANCE category):
| url | device | performance | LCP | FCP | TBT | CLS | requests |
|---|---|---|---|---|---|---|---|
| https://www.python.org/ | mobile | 78 | 4.8 s | 2.7 s | 0 ms | 0.003 | 26 |
| https://www.shopify.com/ | mobile | 60 | 4.4 s | 2.9 s | 760 ms | 0.024 | 145 |
| https://apify.com/ | mobile | 33 | 14.8 s | 3.3 s | 1,740 ms | 0.001 | 249 |
| https://github.com/ | mobile | 29 | 22.0 s | 13.4 s | 1,340 ms | 0.072 | 157 |
Notice the url you send versus the finalUrl Google actually audited (redirects are followed and recorded), and that mobile scores are the throttled-4G Lighthouse view — the same page on desktop scores higher (shopify.com: 60 mobile, 73 desktop in the same session).
✅ What you get
One record per audited page:
url— the URL you sent (normalised to includehttps://).finalUrl— the URL Lighthouse ended on after redirects.strategy—mobileordesktop.fetchTime— ISO timestamp of the audit.lighthouseVersion— Lighthouse version Google ran (13.4.1 at the time of writing).source—psi-api(Google PageSpeed Insights, the normal path) orlighthouse-local(only when a run has 2 GB+ memory and Google could not audit the page).scores— object keyed by category (performance,accessibility,best-practices,seo,pwa— whichever you requested), each{score: 0–100, title}.metrics— object keyed by metric id:first-contentful-paint,largest-contentful-paint,total-blocking-time,cumulative-layout-shift,speed-index,interactive,server-response-time; each{displayValue, numericValue, score}.numericValueis milliseconds (CLS is unitless).opportunities— array of Lighthouse "opportunity" audits that did not score a perfect 100:{id, title, description, score, savingsMs}. Empty array when the page has none.totalRequestCount— number of network requests the page made during the audit;nullwhen Lighthouse did not report it.page_meta— only withaddonPageMetaExtracted: true:title,description,canonical,robots, Open Graph and Twitter-card tags.tech_stack— only withaddonTechStackDetected: true:technologies(detected CMS, framework, analytics and hosting signatures) andtech_count.
Fields that Google does not return for a page are null, never invented.
⚙️ Sample inputs
1. Quick start — one page, mobile, performance only (the Store example):
Returns 1 report. Cost: 1 × $0.10 + start fee = $0.10.
2. Full audit of one page on desktop, all categories:
Returns 1 report with four category scores. Cost: $0.10.
3. Bulk — score a whole list in one run (one run instead of one run per page):
Returns one report per reachable URL (5 here). Cost: 5 × $0.10 = $0.50. Two pages are audited at a time; about 10–15 pages fit the default 5-minute run timeout, so raise the run timeout under Run options for longer lists — pages the run could not start are named in the status message and are not charged.
🧾 JSON sample record
🔧 How it works
- Reachability check. The actor fetches the URL once (10-second limit). A DNS failure, connection refusal or HTTP 404/410 stops the run for that page immediately — in about two seconds, with nothing charged — and tells you why.
- Google PageSpeed Insights. The page is submitted to Google's PageSpeed Insights API with the strategy and categories you chose. Google runs Lighthouse on its own servers (typically 15–60 seconds, heavy pages up to two minutes) and returns the full Lighthouse report. Transient Google errors (HTTP 500 "unable to process", 429 rate limit) are retried up to four times with increasing waits.
- Parse. Category scores, the seven core metrics and the improvement opportunities are lifted from the Lighthouse JSON into the flat record above. Nothing is computed locally; nothing is estimated.
- Add-ons (only when switched on): the page's
<head>is fetched for meta tags, and response headers plus HTML signatures are matched for technology detection. Each add-on is charged only when it produced a value. - Charge and push. One dataset item is pushed per report, and that push is the charge. In bulk mode pages are audited two at a time, each pushed as it completes, and the run status message keeps a running count.
Not done: no login, no CAPTCHA bypass, no scraping of pages behind authentication, no local Chrome at the default memory size (a local Lighthouse fallback exists only for runs started with 2 GB or more, and is slower and less stable than Google's result).
💰 Pricing example
Live prices for this actor (pay-per-event):
apify-default-dataset-item— $0.10 per report delivered.apify-actor-start— $0.00005 per run start (effectively free).addon-page-meta-extracted— $0.02 per page, only whenaddonPageMetaExtractedis on and meta was extracted.addon-tech-stack-detected— $0.02 per page, only whenaddonTechStackDetectedis on and a stack was detected.
Worked examples:
- One page, no add-ons: 1 × $0.10 + $0.00005 = $0.10.
- 25-page site audit in one bulk run, no add-ons: 25 × $0.10 = $2.50 (set the run timeout to 20 minutes for a list this size).
- 10 pages with both add-ons: 10 × ($0.10 + $0.02 + $0.02) = $1.40.
If a run returns 0 reports (unreachable page, or Google could not audit it), you pay the start fee only — a fraction of a cent.
Yield note. Live, public pages come back with a report; the ones that do not are pages Google's crawler cannot render (bot walls, login redirects, pages over ~60 s to load) or pages that return HTTP 4xx/5xx. Google's audit is a single lab run under throttled conditions, so the score can move a few points between runs on the same page; for trend reporting, compare the same strategy over time and read numericValue, not just the rounded score.
⚖️ Legal & ToS
The actor requests public web pages exactly as a browser would and submits the URL to Google's PageSpeed Insights API, subject to Google's API terms. It reads no private data, sets no cookies, submits no forms and does not attempt to bypass access controls. Use it on sites you own, sites you have been engaged to audit, or public pages for competitive benchmarking — the same use PageSpeed Insights itself is built for. Lighthouse and PageSpeed Insights are Google products; this actor is an independent NexGenData tool and is not affiliated with Google.
🆘 Troubleshooting
- Run failed: "URL unreachable" / "HTTP 404" → the address is wrong or the page is gone. Nothing charged. Check the URL in a browser and re-run.
- "Google PageSpeed Insights could not analyze … right now (API error after retries)" → Google's audit backend returned errors for about a minute (this happens in bursts). Nothing charged. Re-run in a few minutes; if it persists for one specific page, the page is likely blocking Google's crawler.
- Bulk run says "N not started (run time limit)" → the list did not fit the run timeout. Raise Run options → Timeout (about 20 s per page, two in parallel) and re-run with the remaining URLs.
- Scores look "too good" / everything 100 → check
finalUrl; a redirect to a lightweight placeholder or consent page will score high. Audit the page you meant. totalRequestCountis null → Lighthouse did not report network records for that page; the scores are still valid.- Add-on fields missing → the add-on toggle is off (default), or the page exposed no meta tags / no recognisable stack; add-ons are charged only when they returned a value.
⭐ Found this useful?
A rating on the Store helps other buyers find it — thank you.
Run it on a schedule
Page speed changes when a site changes, not on a fixed clock, so a weekly run over your key pages is enough for client reporting, and a daily run works as a regression check after deploys. Each run is a fresh snapshot: the same pages come back with updated scores and Core Web Vitals, not new rows to collect. Nothing is stored between runs and there is no new-only mode, so compare scores.performance.score or the metric numericValue fields run over run in a sheet. Keep the same strategy across runs, because mobile and desktop scores differ. Send each run's results onward with a webhook, Google Sheets, Zapier, Make or the Apify API.
Video guides from Apify: Schedule your Actor · Integrations
FAQ
Why use this instead of the official PageSpeed Insights website?
PageSpeed Insights is free and gives the same numbers, because this actor runs on Google's PageSpeed Insights API. What it adds is scale and structure: send a list of URLs and get one flat JSON record per page with category scores, seven core metrics and improvement opportunities, ready for a sheet or dashboard. It needs no Google API key, it runs on a schedule, and unreachable pages are not charged. It is an independent tool and is not affiliated with Google.
What does a typical run cost?
You pay per result, not for run time: $0.10 for each row in the results, plus $0.00005 per run start (charged per GB of run memory, minimum one). A run that returns one row, like the Store example, costs about $0.10. Optional extras are charged only when you turn them on: tech-stack add-on per page $0.02; page-meta add-on per page $0.02. Live prices are always shown in the Pricing tab.
How do I check Core Web Vitals for many pages at once?
Put the pages in urls, pick mobile or desktop, and choose your categories. You get one report per reachable URL with LCP, FCP, TBT, CLS, Speed Index, Time to Interactive and server response time. Pages are audited two at a time, and about 10 to 15 pages fit the default 5-minute timeout, so raise the run timeout for longer lists.
Why is my mobile score much lower than desktop?
Lighthouse mobile simulates a mid-range phone on a throttled 4G connection, and desktop does not. Both are Google's standard profiles. Search Console reports mobile.
Why does the score change between runs on the same page?
Each audit is a single lab run, and network conditions and third-party scripts vary. A few points of movement is normal. For trends, compare the same strategy over time and read numericValue rather than the rounded score.
Can it audit pages behind a login?
No. Google has to be able to fetch the page anonymously, so pages behind a login, bot wall or consent redirect will fail or score the wrong page. Check finalUrl to confirm which page was audited.
Related actors
- Lighthouse Bulk Checker — Performance at Scale — the sibling built for large URL lists.
- WCAG 2.2 Accessibility Auditor — Bulk axe-core — accessibility violations per page for the same client audit.
- Wappalyzer Alternative — Tech Stack Detector & BuiltWith API — a fuller technology fingerprint than the add-on here.
- Website Contact Details Extractor — Contact Scraper — contacts from the sites you audited, for outreach.
- SEO & Web Analysis MCP — Crawl, Tech & DNS for Agents — site analysis tools for AI agent workflows.


