

X Tweet Viral Score Analyzer with AI | $0.0003/Tweet
Pricing
from $0.0003 / analyzed tweet
X Tweet Viral Score Analyzer with AI | $0.0003/Tweet
Check any tweet's viral score with AI, AI costs included. See why tweets go viral or flop, with every score beside real engagement, from $0.0003 per analyzed tweet on every Apify plan. World's fastest & cheapest X (Twitter) scraper service. Not affiliated with X Corp.
Pricing
from $0.0003 / analyzed tweet
Rating
5.0
(2)
Developer

Xquik
Maintained by CommunityActor stats
1
Bookmarked
2
Total users
1
Monthly active users
4 hours ago
Last modified
Categories
Share
English · Español · Türkçe · 简体中文 · 日本語 · 한국어 · Deutsch · Français · Italiano
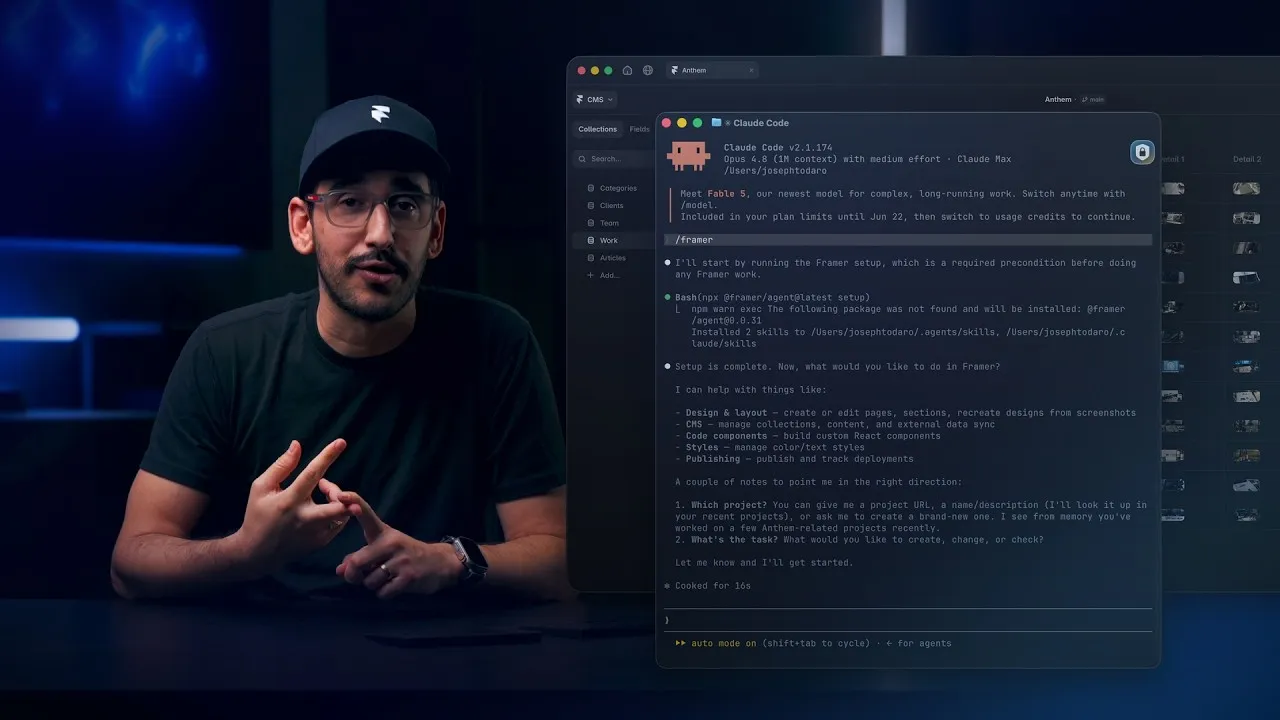
Watch how Framer uses Xquik scrapers
with Claude Code, Codex, Cursor & more, from 6:07.
Xquik is the world's fastest & cheapest X (Twitter) scraper service with the most complete X data. Xquik's X Tweet Viral Score Analyzer rates every tweet. It adds a Viral Score estimate & a verdict. Most other Apify Actors charge before filtering or deduplicating. Xquik charges only for delivered, unique, filter-matching results. AI costs are included in the per-tweet price. You need no AI account, tokens or key.
Learn why tweets spread or flop & keep the original tweet data. Xquik's X Tweet Viral Score Analyzer with AI collects matching tweets. The AI rates 8 traits of each post. The Actor turns those answers into a Viral Score estimate & a verdict. Every row keeps real likes, reposts, replies & quotes. Compare each estimate with what happened.
- Viral Score per post. Fixed, versioned rules compute each score from 0 to 100.
- 8 trait answers. They show why a post scored high or low.
- Hard stops. They cap posts that read as spam, ragebait or generic machine copy.
- Complete source records. Every row keeps every field the tweet exposes.
The Viral Score estimates how well the wording works. It does not predict likes or views. It does not reproduce how X ranks posts.
Xquik is an independent third-party service. Not affiliated with X Corp. "Twitter" and "X" are trademarks of X Corp.
How to check a tweet's viral score
New to Apify? Create a free account first. The free plan needs no credit card & gives $5 to spend each month. At $0.0003 per analyzed tweet, $5 pays for up to 16,000 analyzed tweets before platform usage. Then come back here & press Try for free.
- Add search terms, profile handles, tweet URLs or tweet IDs.
- Set
maxItems& the extraction filters your task needs. - Describe your audience in
analysis.context, or leave the default. - Start the run & open the
Viral Scoredataset view.
What the Actor answers
| Question | Answer |
|---|---|
| Hook | 0 no hook, 1 clear opening, 2 sharp opening |
| Clarity | 0 confusing, 1 takes effort, 2 clear on first read |
| Informative | 0 nothing new, 1 familiar point, 2 useful takeaway |
| Funny | 0 not funny, 1 mildly amusing, 2 funny enough to share |
| Ragebait | Probability that the post mainly provokes outrage |
| AI written | Probability that the text reads like generic machine copy |
| Spam | Probability of spam, scam, giveaway or engagement farming |
| Reaction | Share, reply, like, argue or ignore |
The AI-written answer judges style only. It does not establish who wrote the post.
How the viral score works
Hook, clarity, payoff & the expected reaction raise the score. Wording that reads like generic machine copy lowers it.
Hard stops cap the score of likely spam, ragebait & generic machine copy. The score is a whole number from 0 to 100.
| Verdict | Score |
|---|---|
send_it | 70 to 100 |
edit_first | 40 to 69 |
sleep_on_it | 0 to 39 |
viral.weights names the version of these rules, such as viral_lite:1. It
changes whenever the rules change. The score is null after a failed or skipped
analysis. It is also null when a default trait answer is missing. Xquik's X
Tweet Viral Score Analyzer never fills a missing score with a guess.
Algorithm score estimate
X published its ranking weights in the repository xai-org/x-algorithm, file
home-mixer/params/param.rs. Xquik's X Tweet Viral Score Analyzer applies 4 of
them to each post's public counts.
| Count | Weight |
|---|---|
| Like | 0.66 |
| Reply | 5 |
| Repost | 1 |
| Quote | 5 |
viral.algorithmWeightedSum is the sum of each count times its weight.
viral.algorithmScore divides that sum by views & multiplies by 1,000. A post
without a view count uses followers instead. viral.algorithmBasis names the
divisor, views or followers. Compare scores with the same basis only.
viral.weightsVersion names the weights, such as
x_algorithm_params:2026-10-14.
The estimate has these limits.
- X multiplies each weight by a probability it predicts for one viewer. The Actor multiplies by observed counts. The result is an estimate, not the score X computes.
- X publishes no weight for bookmarks or views. The sum leaves both out.
- X uses more signals than these 4, such as dwell time & shares. Public data does not show them.
- The score is
nullwhen a post has no views & no follower count. - The AI never sees these counts. It reads the text & context only.
Predicted against actual
Xquik's X Tweet Viral Score Analyzer compares each Viral Score with what
happened. viral.actualEngagementRate is
log10(1 + weighted sum per 1,000 followers). The log limits the effect of one
very large post. The rate is null when the follower count is missing or 0.
The run summary's viral.calibration block reports these fields.
comparedPostscounts posts with a Viral Score & an actual rate.rankCorrelationis a Spearman rank correlation from -1 to 1. It shows whether higher scores went with higher rates.calibrationScoreis 100 times the correlation, floored at 0.overperformers&underperformerslist up to 5 posts each. Each has its tweet ID, URL, Viral Score, actual rate &gap.
gap is the standardized actual rate minus the standardized Viral Score. A post
enters a list when its gap reaches 1 standard deviation.
The calibration has these limits.
- Fewer than 10 compared posts give a
nullcalibration with the reasontoo_few_posts. Identical scores or rates giveno_variation. - The correlation is approximate.
- The calibration describes one run. A low score can mean the posts differ in timing, topic or audience. It does not prove the wording estimate failed.
- Young posts have not finished collecting engagement. Compare posts of similar age.
Account report
The run summary's viral.accounts block reports each author handle.
- Post count, average Viral Score & average actual engagement rate.
- The best & worst post by Viral Score, with tweet ID & URL.
- Average Viral Score per bucket. Buckets are posting hour in UTC, text length band, has media, has link & self-thread.
Text length bands are short, medium, long & extended. short ends at 80
characters, medium at 200 & long at 280. extended covers longer text. A
self-thread post replies to its own author.
The report has these limits.
- The report lists the 50 handles with the most scored posts.
- The report tracks the first 1,000 handles of a run.
untrackedPostscounts scored posts from later handles & posts without a handle. - A bucket with few posts says little. Check
postsbefore you compare averages. - Buckets show what went together in this run. They do not show cause.
Leaderboard
The run summary's viral.leaderboard block ranks the handles of the account
report. byViralScore ranks by average Viral Score. byActualEngagementRate
ranks by average actual rate. Each list holds up to 20 handles with rank,
posts & average.
The leaderboard has these limits.
- A handle needs at least 3 scored posts to rank.
- The rate list skips handles without a follower count.
- More posts, then the handle name, break ties.
- The leaderboard covers the posts of one run, not an account's whole history.
Score a draft before you post
Paste your own text in texts. Xquik's X Tweet Viral Score Analyzer scores it &
fetches nothing from X.
- Each text becomes 1 row with
viralScore,viralVerdict&viral.stops. tweet.idistext:1,text:2& so on, &tweet.typeistext.- A draft has no likes or views yet, so
viral.algorithmScorestaysnull. - Each analyzed text costs the same $0.0003 as an analyzed tweet.
- With
textsset, the run analyzes only those texts. Run X targets separately.
How much does it cost to check viral scores?
Xquik's X Tweet Viral Score Analyzer costs from $0.0003 per analyzed tweet. It charges no start fee. The price includes collection, AI costs & the Viral Score. You need no AI account, tokens or key. The price covers up to 8 questions & 64,000 bytes of context per tweet. Each question definition may use up to 8,000 bytes.
For more volume, pick an Apify plan with more prepaid usage.
Extraction filters & deduplication run before analysis. You never pay for filtered-out or duplicate rows. Failed analyses, skipped analyses & diagnostic rows have no result charge. Apify bills platform usage for compute, storage & transfer separately at your plan's rates. The Pricing tab shows it.
Input & output examples
The input above is copy-ready. An abbreviated output row looks like this.
Each result contains tweet, analysis & viral. Answers include types,
question versions & available probabilities. viral.stops lists the hard stops
that capped the score. A row with a failed or skipped analysis keeps the
collected tweet & a reason. Its answer list is empty & its score is null.
Free diagnostics in the key-value store explain invalid inputs, missing results & interrupted collection. The run report separates collected rows, charged analyses & pending charges.
Run summary & flat answers
A run writes an analysis-summary record to its key-value store in 3 cases.
- It hits a problem or is large.
- Its comparison finds a changed, new or not comparable tweet.
- It has
alwaysSaveRunRecordson.
Other runs skip the record, including the first run of a series. Their status
names the top answer, like Average Viral Score is 64. A comparison without a
change states No change since the earlier run. A run that hits a problem or is
large also writes run-report. So does a run with alwaysSaveRunRecords on.
run-report repeats the summary under results.analysisSummary.
The summary counts analyzed, failed & skipped rows. It sums engagement & summarizes every question.
- The
viralblock reportsaverageScore& the count of each verdict. It also counts scored & unscored rows. - The same block holds
calibration,accounts&leaderboard, described above. - Score questions report a mean & an engagement-weighted mean.
- The
reactionsplit shows how many tweets fall into each reaction. toplists the 3 most engaged tweets per reaction.- Every row lists
sourceDomains, the hostnames it links to. - Every row lists
cashtagsfound in its text, such as$NVDA. - With
monitor.baselineDatasetIdset, the summary'smonitorblock counts comparison statuses. It lists up to 50 changed rows.
An empty run reports counts of 0 & a null average.
Every result row also carries viralScore, viralVerdict,
viralAlgorithmScore & viralActualEngagementRate. It also carries answers,
a flat map keyed by question ID. Each value is the chosen category, score or
probability. The Viral Score dataset view & CSV or Excel exports show these
columns. They sit beside the tweet, so spreadsheets need no JSON parsing. Failed
& skipped rows carry an empty map.
Compare with an earlier run
Pass monitor.baselineDatasetId, the dataset ID of a completed earlier run with
the same analysis settings. The comparison reads that run's rows. It works even
when that run skipped its summary. Every row then gains a monitor object. Its
status takes these values.
first_runwithout a baseline.new_to_baselinefor tweets the earlier run did not have.unchangedorchangedfor tweets it had.
changes lists each trait decision that moved from previous to current.
Decisions compare by category, rounded score level or yes/no at 0.5. A decision
counts as changed only when it moves clearly. Near ties between runs stay
unchanged.
A baseline above maxBaselineRows, or from different settings, stops the run
before collection. The run then writes a diagnostic row. maxBaselineRows
defaults to 100,000.
Task examples
Choose from 50 public tasks. Each starts from a real English search & a bounded
maxItems. It uses the Viral Score dataset view. Some add audience context.
Edit the search or context before running.
- Viral score of AI startup launch tweets
- Viral score of SaaS founder build in public posts
- Viral score of Product Hunt launch posts
- Viral score of Developer tool announcements
- Viral score of Open source release posts
- Viral score of Crypto project announcements
- Viral score of Parenting humor posts
- Viral score of Office humor posts
- Viral score of Pet photo captions
- Viral score audit of NASA posts
- Viral score audit of Duolingo posts
- Viral score audit of Wendy's posts
The remaining tasks cover more topics & brand accounts on the Actor page.
FAQ & support
Answers to common questions, then where to get help.
Do I need an AI account, X API key or login?
No. Xquik's X Tweet Viral Score Analyzer includes AI costs in its price. You need no AI account, tokens or key. You also need no X API key, login or credentials.
Does a high score mean a tweet will go viral?
No. The score estimates how well the wording works for a general reader. Timing, audience size, media & luck also decide reach. Compare scores with the real engagement counts on each row before you rely on them.
Can I use my own questions?
Yes. Custom analysis.questions replace the defaults. Send 1 to 8 choice,
score or probability questions. Choice questions accept 2 to 255 categories.
Score questions need at least 2 ordered levels. The Viral Score needs all 8
default questions, so custom questions leave it null.
Why did a row come back with a failed or skipped analysis?
analysis.status is failed or skipped. The Actor collected & delivered the
tweet, but the AI analysis did not complete. analysis.reason names the cause.
context_limit means your context & targets leave no room for the tweet.
service_unavailable means the analysis service was briefly unavailable. These
rows carry no result charge & no score. Shorten analysis.context or rerun the
affected IDs.
The Actor still analyzes a tweet longer than maxContextBytes. It cuts quoted &
replied-to posts first, then the tweet. analysis.contextAvailability.postText
is then truncated. Raise maxContextBytes up to 64,000 to keep more text.
Does the analysis verify facts?
No. Answers describe what the post expresses & how the post frames it. Probabilities express AI confidence, not truth. Review important classifications against the original tweet, which every row keeps.
Which languages work?
Extraction supports every language X serves. We validate analysis on English customer scenarios first. Other supported languages return answers with the same structure.
How do I limit cost?
Filters, deduplication & maxItems run before analysis. You pay only for
unique, filter-matching tweets. Use precise search operators, date bounds &
engagement floors. Start with a small maxItems to check answer quality before
a large run.
Is it legal to analyze X data?
The Actor requests public X fields. Results can contain personal data. Confirm a lawful purpose & follow applicable privacy rules. Ask qualified counsel when uncertain.
Can I use the API, schedules & integrations?
Yes. See the API tab
for Python, JavaScript & cURL examples. Use Apify
schedules for recurring runs. Pass
the previous dataset ID as monitor.baselineDatasetId to see what changed.
Apify integrations also connect runs to webhooks, Make, Zapier, n8n & Google
Sheets.
Where do I get help?
Open an issue in the Issues tab with the run ID. Free diagnostics in the key-value store explain runs that need attention. A run that gets no row back says why in its status.
Related Xquik Actors
Every Xquik Actor shares the same extraction engine, filter-first billing & diagnostics. Pick the one that matches the data you need.
- X Tweet Scraper scrapes tweets from searches, profile timelines, Lists & tweet IDs with 50+ filters & flat exports. Use it when you need tweet data without analysis. From $0.00015 per row.
- X Profile Scraper scrapes profiles plus their posts, replies, media & followers from handles, IDs or URLs. Use it when you start from accounts rather than searches. From $0.00015 per row.
- X Reply Scraper scrapes replies, comments & whole conversations under posts with 25+ filters. Use it when you need the discussion beneath tweets. From $0.00015 per row.
- X Engagement Scraper scrapes replies, quotes, retweeters & threads for post URLs or IDs in bulk. Use it when you measure who engaged with posts. From $0.00015 per row.
- X Quote Tweets Scraper scrapes the quote tweets of posts with text, media, counts, authors & 11 filters. Use it when you study who quoted posts & what they said. From $0.00015 per tweet.
- X Follower Scraper scrapes followers, following, List members, subscribers & Community members as profile rows. Use it when you need audience or member lists. From $0.00015 per profile.
- X User Search Scraper searches users by handle, bio & location with follower, verification, age & location filters. Use it when you build account lists from search. From $0.00015 per profile.
- X Account Location Scraper checks where accounts are based with X's "Account based in" label, "connected via" & username changes. Use it when you vet where accounts are based. From $0.00015 per account.
- X Email Scraper gets the emails, phones & links accounts publish on their profiles, from handles, followers or user searches. Use it when you need the emails profiles publish. From $0.00015 per profile.
- X List Scraper scrapes List posts, members & followers from List URLs or IDs. Use it when a curated List defines your sources. From $0.00015 per row.
- X Community Scraper scrapes Community info, posts, searches, members & moderators. Use it when your sources are X Communities. From $0.00015 per row.
- X Space Scraper finds Spaces by keyword & reads their titles, states, times, listener counts, hosts & speakers. It also reads broadcasts by URL or ID. Use it when you track live audio & video on X. From $0.00015 per Space or broadcast.
- X Trends Scraper scrapes real-time trends by location with rank, volume, query & WOEID. Use it when you track what is trending where. From $0.00015 per trend.
- X Jobs Scraper scrapes X job listings by keyword, place, workplace, seniority & company, with salaries & apply links. Use it when you collect job openings posted on X. From $0.00015 per job.
- X Article Scraper scrapes long-form X Articles as Markdown & text with covers, authors, dates & metrics. Use it when you need article bodies, not tweets. From $0.00015 per article.
- X Media Downloader extracts or stores photos, videos & GIFs from posts or profiles with MP4 & metadata options. Use it when you need the media files themselves. From $0.00015 per media row.
- X (Twitter) Brand Monitoring with AI Analysis tracks brand mentions with AI relevance, sentiment & customer-experience answers & compares runs. Use it when you watch a brand over time. From $0.0003 per analyzed tweet.
- X Tweet Sentiment Analysis with AI labels attitude, intensity & sarcasm probability for every tweet with AI. Use it when you need general sentiment on any topic. From $0.0003 per analyzed tweet.
- X (Twitter) Stock & Crypto AI Trading Signals labels bullish, bearish, neutral or mixed stance, content type, conviction & asset relevance with AI. Use it when you follow stocks, crypto or trading talk. From $0.0003 per analyzed tweet.
- X (Twitter) News Monitor with AI Analysis labels news posts by format, source attribution & topic relevance with AI. Use it when you separate reporting from commentary. From $0.0003 per analyzed tweet.
- X Tweet Classifier with AI Analysis answers your own category, score & yes/no questions for every tweet with AI. Use it when the preset analyses do not fit your labels. From $0.0003 per analyzed tweet.


