

Salary Benchmarks from Job Posts: Pay Ranges by Role
Pricing
from $3.00 / 1,000 salary buckets
Salary Benchmarks from Job Posts: Pay Ranges by Role
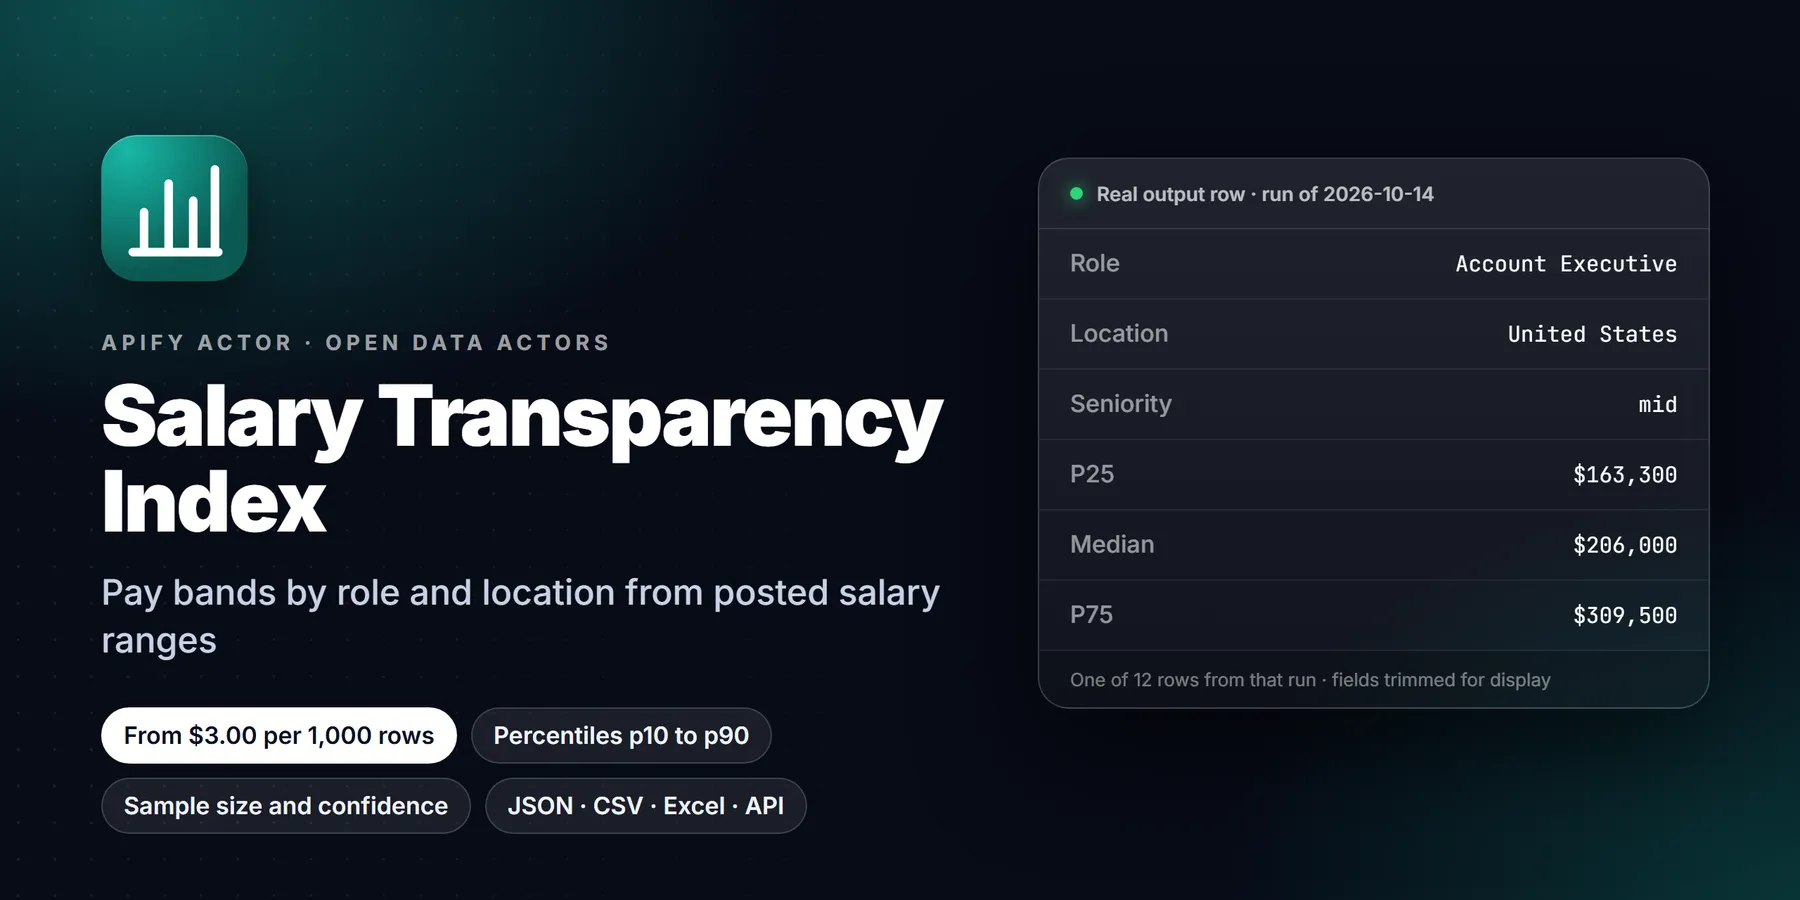
Get pay-range percentiles (p10-p90) by role, seniority and location from pay-transparent job posts on public Greenhouse, Lever and Ashby boards. Sample size, confidence, top payers and job links per row. No login, no proxy.
Pricing
from $3.00 / 1,000 salary buckets
Rating
0.0
(0)
Developer

Detroit Web Agent - Open Data
Maintained by CommunityActor stats
0
Bookmarked
2
Total users
1
Monthly active users
33 minutes ago
Last modified
Categories
Share
Salary benchmarks from job postings: p10, p25, median, p75 and p90 pay by role, seniority and location, computed from pay-transparent Greenhouse, Lever and Ashby job posts, with sample size, a confidence flag, top payers and example job links you can open to check the numbers.
This Actor vs getdataforme/glassdoor-salaries-scraper: that one is more widely used and reads Glassdoor's salary insights by job title and country, with employer ratings. This one computes its percentiles from the pay ranges employers publish in their own job posts, and every bucket shows its sample size and links to example jobs behind it.

| Price per 1,000 rows | Free plan | Starter | Scale | Business |
|---|---|---|---|---|
| This Actor | $5.00 | $4.00 | $3.50 | $3.00 |
Get salary percentiles (p10, p25, median, p75, p90) for a role, seniority level and location, computed from job posts that publish a pay range. Each row is one salary bucket, for example "Senior Software Engineer, Remote (United States), USD base". It carries the sample size, a confidence flag, the companies paying above p75, and 3-5 example job links you can open to check the numbers yourself.
The data comes from the public job-board APIs that company careers pages already use (Greenhouse, Lever and Ashby). There is no login, no proxy, no cookies and no third-party API key. An empty input ({}) returns software-engineering pay for the United States from 13 seed companies in a few seconds.
- What it is: a salary benchmark builder that turns pay-transparent job posts into percentile tables by role, seniority and location
- Data sources: public Greenhouse, Lever and Ashby job-board APIs (structured pay fields first, pay text in the job description second)
- Output: one row per salary bucket with p10/p25/p50/p75/p90, n, currency, yearly basis, confidence, top payers, example job URLs; optional one row per job
- Output formats: JSON, CSV, Excel, XML, HTML table (Apify dataset)
- Access: Apify Console, REST API, JavaScript/Python clients, schedules, webhooks, Apify MCP server
- Login, proxy or third-party API key needed: no, only an Apify account
- Also known as: salary data API, compensation benchmark, pay range scraper, salary percentiles from job postings, pay transparency data
What does it do?
- Reads company job boards. For each company you list (or the preset's seed list) it calls that company's public board API:
boards-api.greenhouse.io,api.lever.coorapi.ashbyhq.com. These are the same JSON feeds the company's own careers page loads. - Extracts a pay range for every job that has one. Structured fields come first: Greenhouse
pay_input_ranges, LeversalaryRange, Ashby compensation tiers. If a job has no structured range, the actor reads the description and looks for a currency range near pay words ("salary", "pay range", "compensation", "OTE", "per hour"). Funding amounts ("$100M"), headcounts and other numbers without a currency are ignored. - Normalises everything to a yearly figure. Hourly pay is multiplied by 2,080, daily by 260, weekly by 52 and monthly by 12. The original period is kept on the job row.
- Classifies each job. Title goes into a role family (about 40 families, such as software engineer, ML engineer, product manager, account executive, registered nurse, nurse practitioner, data scientist). A seniority level is taken from the title (intern, junior, mid, senior, staff, principal, lead, director, executive). Location is parsed to city, state or province, country and a remote flag.
- Builds buckets and percentiles. A bucket is role family + seniority + location + currency + pay basis (base or OTE). Each job contributes the midpoint of its range. Percentiles use linear interpolation and are rounded to the nearest 100.
- Flags confidence.
highmeans n of 20 or more from at least 3 companies.mediummeans n of at leastconfidentSampleSize(default 10) from at least 2 companies. Everything else islow, andlowSampleis true belowconfidentSampleSize. - Adds evidence.
topPayerslists the companies whose median midpoint in the bucket is above p75.exampleJobshas up to 5 jobs taken at the p10/p25/p50/p75/p90 positions, each with its URL and range.
Real example from a default run on 2026-10-13:
Software Engineer, United States (USD, base): median $221,600/yr, middle 50% $201,000-$255,000, n=73 from 7 companies (high confidence).
Who it is for
A recruiter pricing an offer. Maya hires backend engineers for a Series B fintech. Before she writes an offer she runs the actor with roles: ["backend engineer", "software engineer"] and locations: ["New York"], groupBy: "city". She gets the median and p75 for Senior and Staff in New York, sees which companies pay above p75, and opens two of the example job posts to quote in the comp review.
A founder setting salary bands. Dev is writing the first salary bands for a 30-person startup. He lists the 25 companies he competes with for talent in companies, turns on outputRawJobs so he can audit the inputs in a spreadsheet, and uses the p25-p75 range per level as the first draft of his bands. The structuredPayShare column tells him how much of each bucket came from structured employer fields rather than parsed description text.
A staffing agency or health system tracking clinical pay. A nurse staffing firm runs the healthcare-nursing preset weekly with a monitorKey. The preset buckets by US state. Only buckets whose median moved 5% or more, or whose sample grew, are output, so the weekly run costs cents and the Slack message lists only the states where NP or medical-assistant pay changed.
Other uses: HR analytics teams feeding a comp dashboard, job seekers checking whether an offer is fair, journalists and researchers studying pay transparency laws, and AI agents that need a "what does this role pay" tool.
Input examples
Empty input (default preset: US software engineering, 13 seed companies):
Sales pay, base and OTE kept apart:
Your own competitor set, product managers, by city:
A bare slug such as datadog is probed on Greenhouse, then Ashby, then Lever.
Weekly nurse pay monitor by state:
Every input field:
| Field | Default | What it does |
|---|---|---|
preset | software-engineering-us | One of software-engineering-us, product-design, sales-gtm, healthcare-nursing, data-ml, custom. Sets role families, locations, location level and seed boards. |
roles | [] | Title keywords. When set, they replace the preset's role families. |
excludeRoles | [] | Drop titles containing these words. |
locations | [] | Country, state, city or remote. Empty = the preset's. anywhere = no filter. |
companies | [] | Boards to read (greenhouse:slug, lever:slug, ashby:slug, board URL, or bare slug). Empty = the preset's. |
groupBy | preset | country, state or city. |
bySeniority | true | Separate buckets per seniority level. |
includeOte | true | Keep OTE ranges, in their own buckets. |
minBucketSize | 3 | Smallest bucket that is output. |
confidentSampleSize | 10 | n below which lowSample is true. |
maxBuckets | 100 | Largest buckets first. |
maxJobsScanned | 5000 | Cap on job posts examined. |
outputRawJobs | false | Also output one row per job with pay. |
monitorKey | none | Turns on monitor mode (see below). |
monitorThresholdPct | 5 | Median move that counts as a change. |
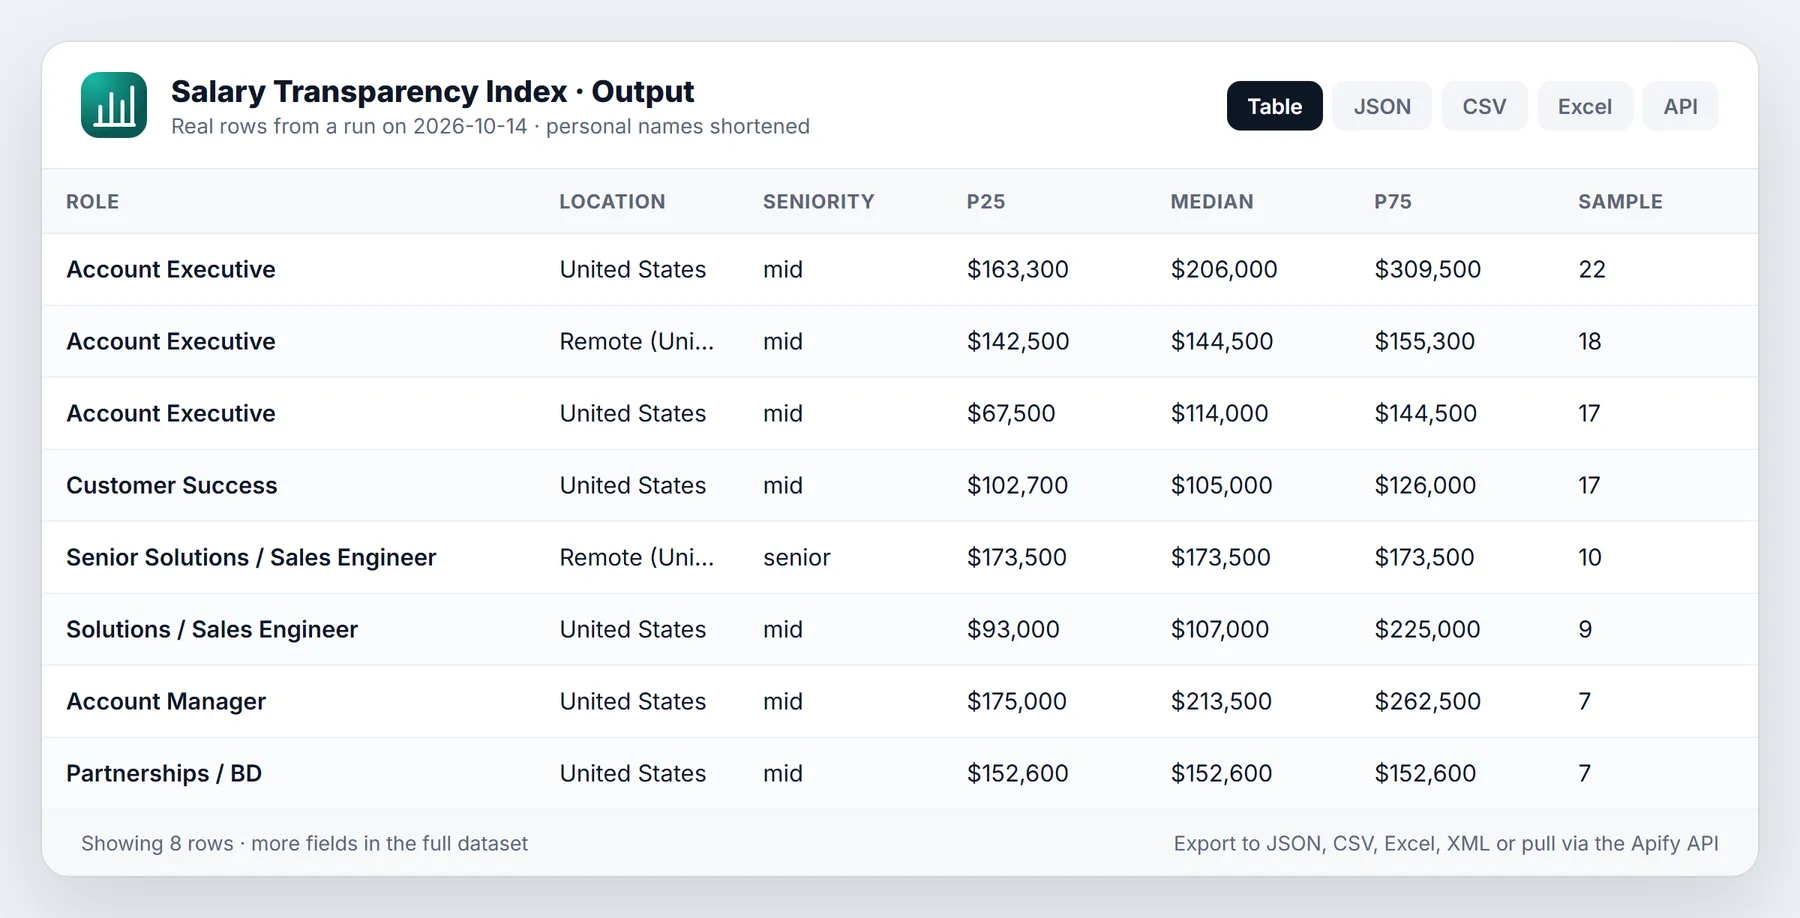
Output example
One real bucket row from a default run on 2026-10-13 (trimmed to one example job):
With outputRawJobs: true, job rows ("type": "job") follow the buckets. They hold title, company, the parsed range in its original period and in yearly terms, the pay text snippet the range came from, the ATS and the job URL.
The run's OUTPUT record in the key-value store lists every board read with its job count and how many jobs had pay, plus how many jobs each filter removed (no pay, role, location, OTE, out-of-range, duplicate).
Signals explained
p10top90: percentiles of the range midpoints in the bucket, yearly, in the bucket's currency. Use p25-p75 (the middle 50%) as the normal band.sampleSizeandcompaniesCount: how many distinct job posts and companies the bucket rests on. A bucket of 12 jobs from one company describes that company's band, not the market. That is why confidence needs several companies.confidence/lowSample: see "What it does". Treatlowas a lead to investigate, not a benchmark.spreadPct: (p75 - p25) / p50. A wide spread usually means mixed levels or mixed cities in one bucket; trygroupBy: "city"or narrower roles.topPayers: companies whose own median in the bucket is above the bucket p75.medianMin/medianMax: median of the posted range bottoms and tops, useful when you care about starting offers rather than midpoints.structuredPayShare: share of the bucket taken from an employer's structured pay field. 1 means every number came from a field the employer filled in; lower values mean some came from description text.payBasis:baseorote. OTE (on-target earnings, base plus variable for sales roles) is never mixed with base pay.changeType(monitor mode):baseline,new,median_up,median_downorsample_grew, withprevP50,p50ChangePctandprevSampleSize.
Pricing
Pay per event, no monthly fee. You pay for buckets delivered, not for jobs read.
| Event | Free plan | Bronze | Silver | Gold / Platinum / Diamond |
|---|---|---|---|---|
| Salary bucket (primary) | $0.005 | $0.004 | $0.0035 | $0.003 |
Job with pay (only if outputRawJobs is on) | $0.001 | $0.0009 | $0.0008 | $0.0007 |
| Actor start | $0.00005 | $0.00005 | $0.00005 | $0.00005 |
Typical costs (Free plan prices; platform compute is small because the actor only reads JSON):
| Run | Buckets | Cost |
|---|---|---|
{} default (US software engineering) | about 30 | about $0.15 |
sales-gtm preset | about 15 | about $0.08 |
| 100 buckets, all presets combined | 100 | $0.50 |
| Weekly monitor, 4 buckets changed | 4 | $0.02 |
| 30 buckets + 450 job rows | 30 + 450 | about $0.60 |
Set Max total charge on the run and the actor stops before the first row it cannot pay for. No row is pushed without being charged, and buckets below minBucketSize, boards that fail and jobs without pay are never charged.
Monitor mode and schedule recipe
Give the run a monitorKey. The actor keeps the last median and sample size of every bucket in a named key-value store (salary-transparency-index-monitor, record m-<monitorKey>). On the next run with the same key:
- a bucket whose median moved by
monitorThresholdPctor more is output asmedian_upormedian_down; - a bucket whose sample grew is output as
sample_grew; - a bucket not seen before is output as
new; - unchanged buckets are not output and not charged.
The first run is a full baseline (every bucket, changeType: "baseline"), so it is useful on its own.
Recipe:
- Run once with your input and
"monitorKey": "my-benchmark". - In Apify Console, save the input as a task and add a weekly schedule.
- Add an integration (Slack, email, Google Sheets, webhook) on "Run succeeded". Only changed buckets arrive.
The baseline for "median moved" is the median recorded when the bucket was last reported, so slow drift adds up and is reported once it crosses the threshold.
Use via API / MCP
REST API (synchronous, returns the rows):
JavaScript:
Python:
MCP / AI agents: add https://mcp.apify.com?actors=transparent_meteorite/salary-transparency-index to Claude, Cursor or any MCP client, then ask "what do senior data engineers earn in the US, and which companies pay the most?". The summary field is written to be quoted directly.
Limits and honest caveats
- Coverage is the seed boards you read. The presets use 5-17 companies each, mostly US tech and health companies that publish pay. A benchmark from 13 companies is a benchmark of those 13 companies. Add your own competitor set in
companiesfor a market view that fits you. Companies that do not publish pay on their board add jobs but no data points. - Midpoints, not offers. Posted ranges are what employers advertise, often wide, and the midpoint is used for percentiles. Actual offers, equity and bonuses are not included (OTE is kept separately).
- Multi-zone ranges. Some employers post several ranges for one job (for example SF/NY tier vs. other US). When the range title names the job's city or state, that range is used; otherwise the first range listed is used. Ranges titled by country (for example "France Annual Pay Range") become one data point per country.
- No currency conversion. Buckets are per currency. A London job in GBP and a Berlin job in EUR never share a bucket.
- Description parsing is a fallback. It needs a currency symbol or code and a pay word nearby, skips ranges where max is more than 4x min and yearly midpoints outside 10,000-2,000,000. It can still miss unusual formats;
paySourceandpayTexton job rows show where each number came from. - Title families are rules, not AI. About 40 families are recognised; other titles become
other:<cleaned title>buckets. Seniority comes from title words, so "Software Engineer II" counts as mid-level. - Multi-location posts use the first location listed.
- LinkedIn is not used. Its robots.txt disallows crawling, so this actor does not read it. Indeed, Glassdoor and other sites that need login or block automated reads are also not used.
- Workday boards are not read by this actor. They rarely carry structured pay.
- Board APIs are read with at most 3 requests in flight per host and retries with backoff.
Run in 30 seconds
- Open the Actor in Apify Console and click Try for free (or Start if you already have an account).
- Open the Input tab, switch to JSON, and paste the example below. It is small on purpose, so the first run is quick and cheap.
- Click Start. Most small runs finish in well under two minutes.
- Open the Output tab to read the Overview table, or use Export to download JSON, CSV or Excel.
Once the sample looks right, replace the example values with your own list and raise the limits.
Example API call
Run a benchmark from code and read the bucket rows. Replace the placeholder token and username.
Tips for cleaner benchmarks
- Check the sample size before quoting a figure. Buckets below
confidentSampleSizeare flagged as low sample. - Raise
minBucketSizeto drop thin buckets; lower it when you want to see every pay signal. - Lower
maxJobsScannedfor a quick test, and raise it for a full market view. - Set
outputRawJobstotruewhen you want to audit the individual posts behind a bucket. - Use a stable
monitorKeyto track pay movement over time.
FAQ
How fresh is the data? Every run reads the boards live, so the numbers reflect jobs open at run time. checkedAt is the run time.
Why do I see fewer buckets than I expected? Buckets below minBucketSize (default 3) are dropped. Check the OUTPUT record: filteredOut.noPay tells you how many matching jobs had no pay range. Lower minBucketSize, turn off bySeniority, use groupBy: "country", or add companies.
Can I get one benchmark per company? Use companies with one board and minBucketSize: 1, or turn on outputRawJobs and group the job rows yourself.
Is hourly pay supported? Yes. Hourly ranges are converted at 2,080 hours a year. The job rows keep originalPeriod: "hour" and the original numbers.
Which companies publish pay on these boards? Many US employers do because of pay transparency laws in states such as California, Colorado, New York and Washington. The presets list companies checked on 2026-10-13. Any Greenhouse, Lever or Ashby board works in companies.
Does this compete with job-listing scrapers? No. It outputs aggregated pay statistics. If you need the job listings themselves, see the related actors below.
Is this legal? The actor reads only public job-board APIs that companies publish for their careers pages. It does not log in, solve CAPTCHAs, or read sites whose robots.txt forbids it. Check your own use against your local law.
Related actors
- ATS Open Roles: open jobs from Greenhouse, Lever and Ashby boards as listings.
- Hiring Velocity Signals: per-company hiring momentum scores.
- Remote Jobs Aggregator: remote jobs from 6 public job boards, deduped.
- Workday Jobs Scraper: jobs from Workday career sites.
- Company Enrichment by Domain: firmographics for a list of domains.
More from DWA Open Data
Browse all 69 data Actors, with live prices and sample output, at open-data-actors.pages.dev.
Feedback: if this Actor was useful, or if it fell short, an honest review on the Reviews tab helps other users decide. Problems or feature requests: please open an Issue and we usually reply within one business day.


