

Screener Scraper | Stock Fundamentals, NSE & BSE
Pricing
from $8.00 / 1,000 companies
Screener Scraper | Stock Fundamentals, NSE & BSE
Screener.in scraper for NSE and BSE stock fundamentals: price, market cap, P/E, ROCE, ROE, growth rates, shareholding, quarterly and annual statements, peers, announcements and annual reports. 10 companies in 22 seconds, 72 fields each. Start from symbols, BSE codes, names, screens or sectors.
Pricing
from $8.00 / 1,000 companies
Rating
0.0
(0)
Developer

SilentFlow
Maintained by CommunityActor stats
0
Bookmarked
2
Total users
1
Monthly active users
4 days ago
Last modified
Categories
Security
Limited permissionsShare
Screener Scraper | Stock Fundamentals for NSE and BSE Companies (2026)
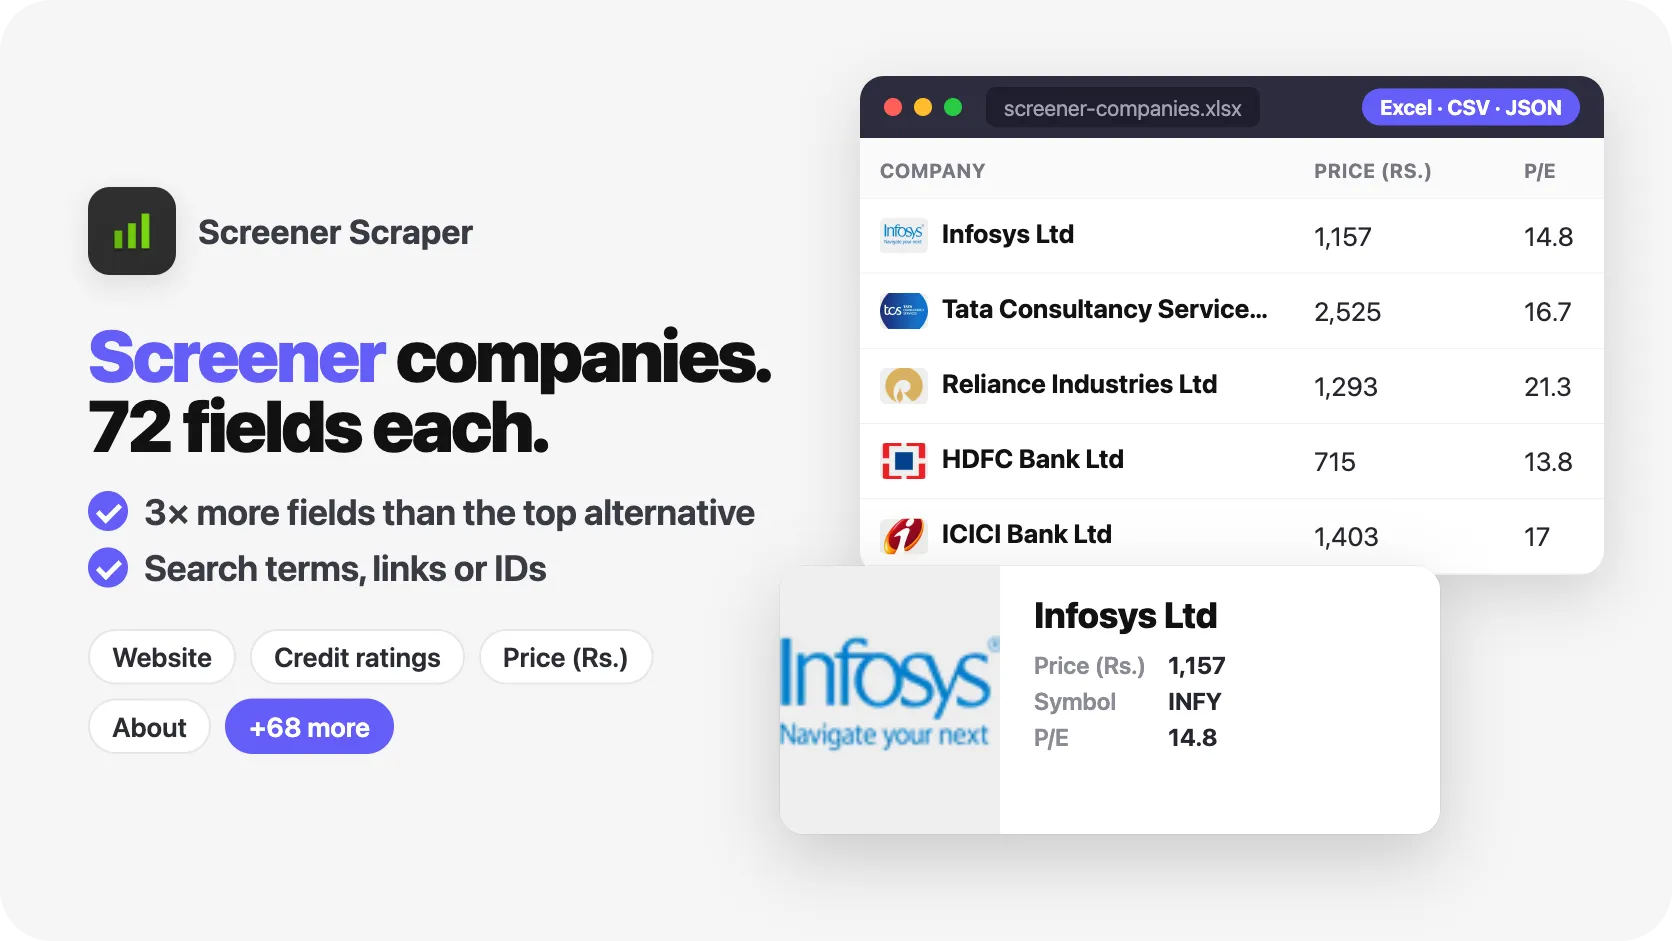
From SilentFlow. Creators of Facebook Search Scraper and JD Products Scraper (#1 for “jd scraper” in Apify Store search), with 880,000+ combined lifetime runs.
Every NSE and BSE company on screener.in as one clean row: price and key ratios, 3, 5 and 10 year growth, the latest shareholding pattern, 13 quarters and 12 years of statements, sector peers and the company's filings. Our default test run read 10 Nifty 50 leaders in 22 seconds: 69 data fields held a value on all 10 rows, 71 on at least half of them.
Why choose this actor?
Copying screener.in tables into a spreadsheet one company at a time? Getting a name, a price and a nested blob from a scraper, and still opening the page for the growth rates, the shareholding or the annual reports? Running a screen and getting back its columns, but not the companies behind them?
- 71 fields filled per company, not 17. In our default run of 10 companies, 71 data fields held a value on at least half of the rows and 69 on all 10: screener ID, link, name, symbol, NSE code, BSE code, financials type, about, key points, website, logo, broad sector, sector, broad industry, industry, index memberships, pros, cons, current price, day change, market cap, 52-week high and low, P/E, book value, dividend yield, ROCE, ROE, face value, sales growth over 10, 5 and 3 years and TTM, profit growth over the same spans, price CAGR over 10, 5, 3 and 1 years, ROE over 10, 5 and 3 years and last year, latest quarter with its sales, net profit and EPS, TTM sales, net profit and EPS, promoter, FII, DII, government and public holding with the shareholder count, then quarterly results, profit and loss, balance sheet, cash flow, efficiency ratios, quarterly and yearly shareholding, peers, announcements, annual reports, credit ratings and concalls. The most used screener.in actor on the Store shows 17 fields in its output example.
- Type a symbol, a BSE code or just a name.
INFY,500209andInfosysall land on the same company. In our test,500325returned Reliance Industries,Tata Elxsireturned Tata Elxsi Ltd, a search forpharmareturned the 8 companies screener.in suggests (Sun Pharma, Torrent, Mankind, Aurobindo, Glenmark, Gland, GSK Pharma and Pharmaids), and an unknown name was reported in the log instead of failing the run. 10 rows in 16 seconds. - A whole index, sector or screen, each company complete. Paste a screener.in link and every company it lists gets its full row, in the page's own order. The Nifty 50 link returned all 50 constituents in 58 seconds with 70 fields filled; the public FII Buying screen listed 98 companies and returned the first 30 across two pages in 70 seconds, 10 of them read from their standalone figures because they file no consolidated results.

Try your first 10 companies
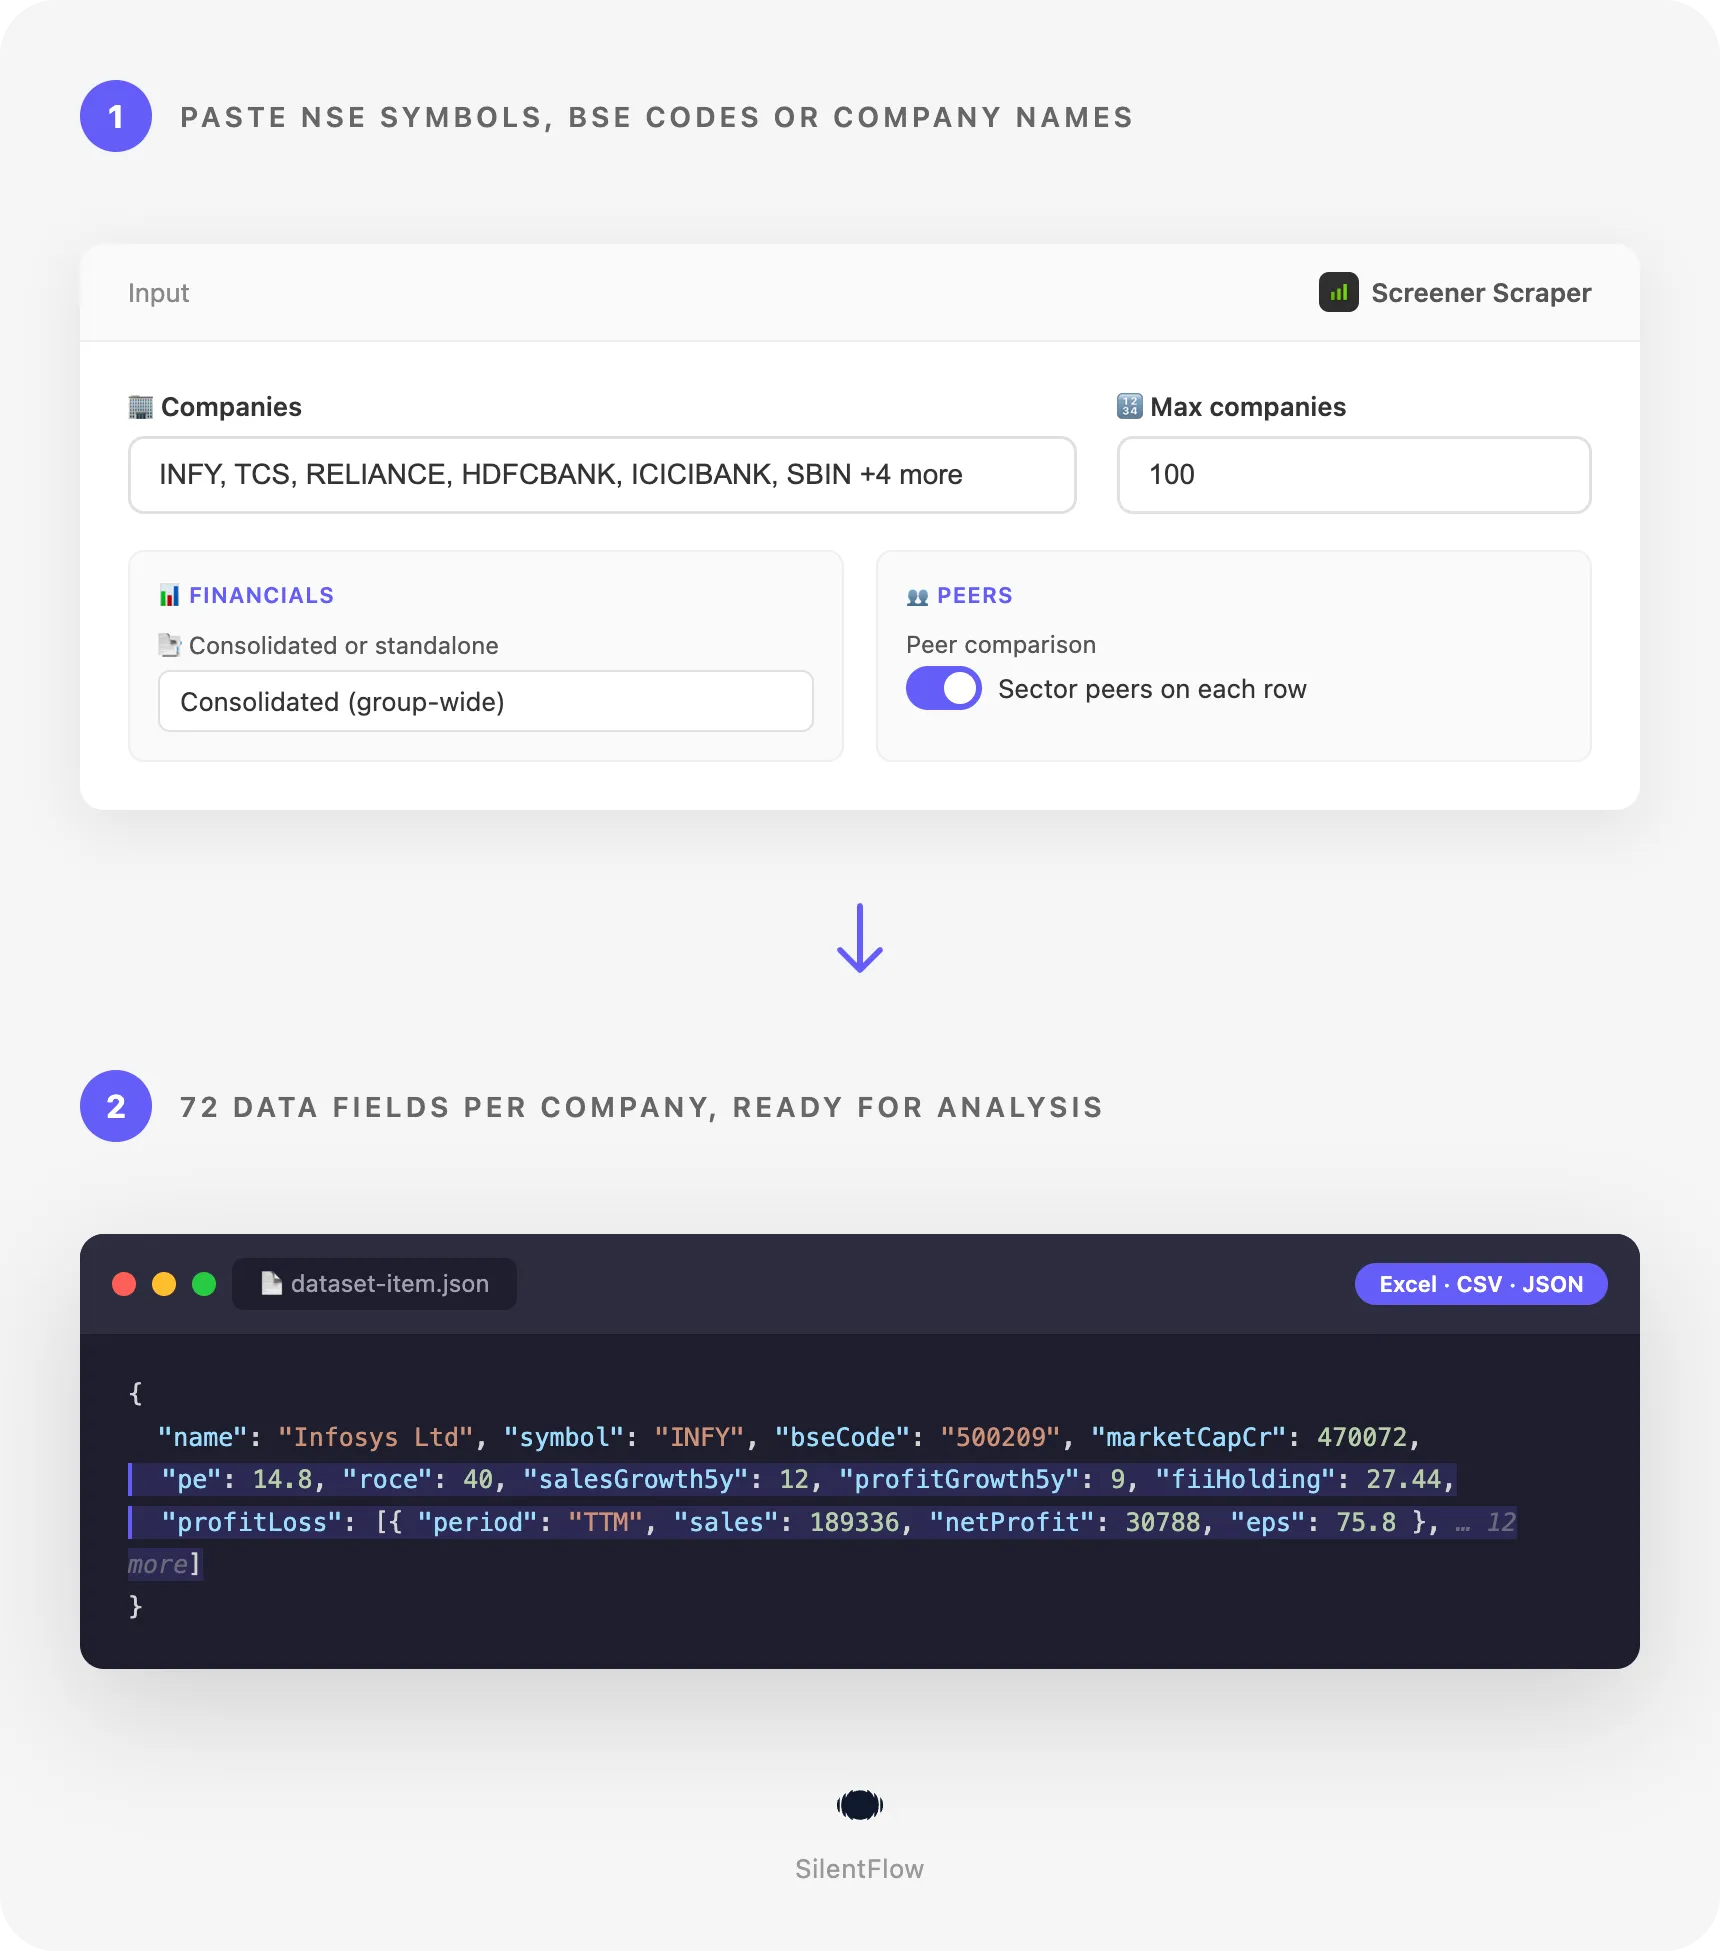
Paste this input in the JSON tab of the Input page and press Start. It reads 10 Nifty 50 leaders from screener.in, each with its consolidated figures and its sector peers.
It runs on the Apify Free plan. Each company becomes one row of your dataset: open the Output tab to see the "Companies" table with the name, symbol, industry, price, market cap, P/E, ROCE and link, or switch to the "Growth and ownership" view for 5-year growth, ROE and holdings. Export the rows as JSON, CSV or Excel, or pull them from the API into your own tools.
Copy to your AI assistant
Paste this block into Claude, ChatGPT or Cursor to give it full context about this scraper:
How to scrape screener.in company data
Get the fundamentals of your watchlist
List NSE symbols or BSE codes. Each one returns its full row with consolidated figures and sector peers.
Find companies when you only know the name
Mix names in the company list and use the search for a word shared by a group or a theme. Each search returns up to 8 listed companies, the same suggestions as the screener.in search box.
Read every company of an index, a sector or a screen
Paste the screener.in link. Lists are read page by page, 25 companies a page, in the page's order, and each company gets its full row.
Input parameters
| Parameter | Type | Default | What it does |
|---|---|---|---|
companyIds | array of strings | 10 Nifty 50 leaders in the form | NSE symbols, BSE codes or company names. One row per company. |
searchQueries | array of strings | empty | Words from a company or group name. Each returns up to 8 best matches. |
startUrls | array of links | empty | Company pages, public screens, sector and industry pages, index constituents. |
maxItems | integer | 100 | Stop after this many companies across all inputs. |
financialsType | consolidated or standalone | consolidated | Group-wide figures, or the parent company only. |
includePeers | boolean | true | Add the sector peer table to each row. Turn it off for faster runs on long lists. |
debugMode | boolean | false | Detailed progress lines in the log. |
No field is required. An empty input reads the 10 example companies, so the form runs as it opens.
Accepted formats
- Symbols and codes:
INFY,infy,M&M,BAJAJ-AUTO,500209. Case does not matter. A BSE code reaches the same page as the NSE symbol. - Names:
Infosys,Tata Steel,Asian Paints. A name is matched to the closest listed company; a name nothing matches is named in the log and skipped. - Company links:
https://www.screener.in/company/INFY/or.../INFY/consolidated/, with or withouthttps://andwww. A link that ends in/consolidated/keeps its consolidated figures whateverfinancialsTypesays, so one run can mix both kinds. - Screens: any public screen,
https://www.screener.in/screens/343087/fii-buying/, read in the screen's own order (screener.in sorts screens for its members only, so a?sort=on a screen link is dropped). - Sectors and industries:
https://www.screener.in/market/IN03/(Energy) down to the narrowest industry,https://www.screener.in/market/IN08/IN0801/IN080101/IN080101001/. - Indices:
https://www.screener.in/company/NIFTY/,.../CNX500/(Nifty 500),.../1001/(BSE Sensex): the link of an index returns its constituents. - Sorted lists: sort a sector or an index on screener.in and copy the link, for example
https://www.screener.in/market/IN03/?sort=return+on+capital+employed&order=desc; the companies come in that order.
What data can you extract from screener.in?
One row per company, 74 top-level fields in seven groups:
| Group | Fields |
|---|---|
| Identity | id, url, name, symbol, nseCode, bseCode, financialsType |
| Profile | about, keyPoints, website, logoUrl, broadSector, sector, broadIndustry, industry, indices, pros, cons |
| Price and ratios | currentPrice, priceChangePercent, marketCapCr, high52Week, low52Week, pe, bookValue, dividendYield, roce, roe, faceValue |
| Growth | salesGrowth10y, salesGrowth5y, salesGrowth3y, salesGrowthTtm, profitGrowth10y, profitGrowth5y, profitGrowth3y, profitGrowthTtm, priceCagr10y, priceCagr5y, priceCagr3y, priceCagr1y, roe10y, roe5y, roe3y, roeLastYear |
| Latest figures | latestQuarter, quarterSales, quarterNetProfit, quarterEps, salesTtm, netProfitTtm, epsTtm, shareholdingAsOf, promoterHolding, fiiHolding, diiHolding, governmentHolding, publicHolding, shareholdersCount |
| Statements and peers | quarterlyResults, profitLoss, balanceSheet, cashFlow, ratios, shareholding, shareholdingYearly, peers |
| Documents and meta | announcements, annualReports, creditRatings, concalls, searchQuery, sourceUrl, scrapedAt |
How deep the history goes, on the Infosys row of our default run: 13 quarters of results (Sep 2023 to Sep 2026), 12 years of profit and loss plus a TTM column (Mar 2015 to TTM), 13 balance sheet columns, 12 years of cash flow and of efficiency ratios, 12 quarters and 11 years of shareholding, 6 peers, the 5 latest announcements, 15 annual reports, 6 credit ratings and 41 concall entries. Across the 10 companies of that run: 56 peer rows, 150 annual reports, 60 credit ratings and 484 concall entries.
Usability facts:
- Money is in Rs. crore, as screener.in shows it (
marketCapCr, statement lines, peer figures). Ratios, growth and holdings are percentages as plain numbers (roce: 40means 40 %). - Every number is a number:
4,71,168becomes471168,-2.03%becomes-2.03. A figure the page leaves blank isnull, never0or an empty text. - Statement periods are dates (
2026-09-30for the quarter ending September 2026), the trailing twelve months column isTTM, and each period keeps screener.in's own label (Sep 2026). - Metric keys follow the page's row names in camelCase:
sales,operatingProfit,opmPercent,netProfit,epsfor most companies; banks and lenders reportrevenue,financingProfit,financingMarginPercent,grossNpaPercentinstead, and the flatquarterSalesandsalesTtmread their revenue. id(screener's company id) andurlare stable. Announcement, annual report and concall links point to the exchanges and the companies themselves and stay valid as long as those documents stay online.logoUrlis a screener.in image link.- Dates are RFC 3339: announcements carry their exact time in UTC, credit ratings their day, concalls their month.
Output example
One real row from our default run (Infosys, 3 Nov 2026). Arrays are cut to their first or latest entry here; the dataset keeps them whole.
Advanced usage
Track FII and DII moves across the Nifty 50 every quarter
Schedule this input after each results season. Every row carries 12 quarters of shareholding, so one run gives you the trend, and the "Growth and ownership" view lines up promoter and FII holding next to growth.
Build a sector dataset for a valuation model
A sector page lists every company screener.in files under it; each row brings 12 years of profit and loss, balance sheet and cash flow, ready for a DCF or a ratio screen. The Energy page listed 64 companies in our test.
Rank a sector by return on capital
Sort a sector or an index on screener.in, copy the link, and the run follows that order. In our test this Energy link returned Rajasthan Securities (ROCE 78.6), Castrol India (60.3) and Coal India (35) first.
Read parent-only figures for holding companies
Holding companies and conglomerates look very different consolidated and standalone. Ask for standalone figures and compare them with a consolidated run of the same list.
Feed an LLM or a newsletter with the latest filings
The rows carry the 5 latest exchange announcements with their one-line summary and exact time, the annual reports and the concall transcripts. Run a watchlist each morning and pass announcements to your assistant or your digest.
FAQ
What is screener.in? Screener.in is one of India's most used stock research websites. It shows, for every company listed on the NSE and the BSE, its price and key ratios, ten years of financial statements, the shareholding pattern, peers and filings, and it lets investors build and share stock screens.
Do I need a screener.in account? No. The actor reads the public company pages, public screens, sector pages and index pages that anyone can open. No login, no API key.
What does one row contain? One company: identity and codes, profile and sector path, price and key ratios, growth rates, the latest quarter and TTM figures, the latest shareholding, then the full quarterly results, profit and loss, balance sheet, cash flow, efficiency ratios, quarterly and yearly shareholding, peers, announcements, annual reports, credit ratings and concalls. 71 fields were filled on at least half the rows of our default run.
Can I run a free-text screen query such as "Market Capitalization > 50000"?
Not directly: screener.in only runs free-text queries for logged-in users. Build the query on screener.in, save it as a public screen, and paste its link in startUrls. Any sector page or index page also works as a ready-made list.
How many companies can I get in one run?
There is no fixed limit: maxItems decides. A search returns up to 8 companies per name, a list link as many as it holds (98 for the FII Buying screen, 64 for the Energy sector, 50 for the Nifty 50). In our tests a company took about 1.2 seconds without peers and 2.3 seconds with them.
Why are some fields null?
Because screener.in shows nothing there for that company. Banks and widely held companies (HDFC Bank, ICICI Bank, ITC, Larsen & Toubro) have no promoter, so promoterHolding is null; a company listed less than 10 years ago has no 10-year growth; a suspended stock has no market cap. A blank figure is null, never 0.
Consolidated or standalone: which figures do I get?
Consolidated by default, the group-wide figures most analysts use. Companies that file standalone results only are read standalone automatically and say so in financialsType. Set financialsType to standalone for parent-only figures.
How fresh is the data? Live: every run reads the pages at that moment. Prices follow screener.in's own update (the close price outside market hours), statements change when a company files its results, shareholding after each quarter.
Can I mix symbols, names, searches and links in one run?
Yes. The run reads company IDs first, then searches, then links, and stops at maxItems. A company found twice (a symbol and a screen, say) is saved once.
Are the links permanent?
The screener.in url and the id are stable. Document links (announcements, annual reports, concall transcripts) point to the exchanges and companies and stay valid as long as they keep those files online.
More SilentFlow scrapers
🛒 E-commerce
- JD - JD Products Scraper | JD.com Prices, Brands and Barcodes
- Pinterest - Pinterest Scraper | Pins, Boards and Profiles
- TikTok Shop - TikTok Shop Scraper | Products, Sellers and Creator Videos
- Leboncoin - Leboncoin Scraper | Classified Ads, Prices and Sellers
- Naver - Naver Scraper | Shopping Products, Prices and Reviews
- Back Market - Back Market Scraper | Refurbished Prices
- Leboncoin - Leboncoin Ad Details Scraper
- ImportYeti - ImportYeti Scraper | Suppliers, Importers and Bills of Lading
- Udemy Course - Udemy Course Scraper
- Allegro - Allegro Scraper | Products, Prices and Sellers
- Amazon Seller - Amazon Seller Scraper | Emails, Phones and Ratings
- Naver - Naver Reviews Scraper | Shopping Product Reviews
- 1688 - 1688 Scraper | Products, Reviews, Details, Wholesale Prices
- Naver - Naver Products Scraper | Shopping Prices, Sellers and Ratings
- Coupang - Coupang Detail Scraper | Product Prices and Options
- Store Leads Ecommerce - Store Leads Ecommerce Scraper
- Store Leads - Store Leads Scraper | Shopify Data
- Avito - Avito Scraper | Listings, Prices and Sellers
- Bring a Trailer - Bring a Trailer Scraper
- Lowes - Lowes Products Scraper | Prices, Stock and Specs
- Pinterest - Pinterest Scraper
- Taobao - Taobao Scraper | Products, Details, Prices and Sellers
- Ctrip - Ctrip Scraper | Attractions, Tickets and Reviews
- Eventim - Eventim Scraper | Events, Ticket Prices and Venues
- Leboncoin - Leboncoin Scraper
- Mobile.de - Mobile.de Scraper
- Alibaba - Alibaba Products Scraper | Wholesale Prices and MOQ
- Alibaba - Alibaba Scraper | Products, Supplier Companies and Prices
- Avito - Avito Profiles Scraper | Sellers, Ratings and Reviews
- Back Market - Back Market Scraper | Refurbished Electronics Prices
- Leboncoin - Leboncoin Details Scraper | Full Ad Data and Sellers
- Vinted Marketplace - Vinted Marketplace Scraper
- 1688 - 1688 Reviews Scraper | Ratings, Buyer Photos and Variants
- Agoda - Agoda Scraper | Hotel Prices and Guest Ratings
- AliExpress - AliExpress Reviews Scraper | Feedback, Ratings and Photos
- AliExpress - AliExpress Scraper | Products, Prices and Sales
- BAUHAUS - BAUHAUS Scraper | Product Prices, EAN and Specs
- CARFAX - CARFAX Scraper | Used Cars, Prices and History
- Che168 - Che168 Scraper | Used Car Listings and Prices
- Coles - Coles Products Scraper | Prices, Specials and Nutrition
- eBay Marketplace - eBay Marketplace Scraper
- Europages - Europages Scraper | Suppliers and B2B Companies
- GasBuddy - GasBuddy Scraper | Gas Prices by Station
- Google Hotels - Google Hotels Scraper | Prices, Offers and Ratings
- Homedepot - Homedepot Reviews Scraper | Customer Reviews and Ratings
- Judge - Judge Scraper | Reviews, Ratings and Store Profiles
- Keepa - Keepa Scraper | Amazon Price History and Offers
- MakersRow - MakersRow Scraper | Manufacturers, Capabilities and Reviews
- Mercari - Mercari Scraper | Listings, Sold Prices and Sellers
- RA - RA Scraper | Events, Lineups and Tickets
- Sahibinden - Sahibinden Scraper | Real Estate and Car Listings
- Ticombo - Ticombo Scraper | Ticket Prices and Listings
- Trip - Trip Scraper | Hotels, Prices and Reviews
- Udemy - Udemy Scraper
- VividSeats - VividSeats Scraper | Tickets, Prices and Events
- Walmart - Walmart Scraper | Prices, Reviews, Sellers, Availability
- Webmotors - Webmotors Scraper | Car Listings, Prices and FIPE
- Wildberries - Wildberries Detail Scraper | Product Data, Prices & Sellers
- Woolworths - Woolworths Products Scraper | Prices, Specials and Nutrition
- YandexMarket - YandexMarket Scraper | Products, Prices and Sellers
- Zap - Zap Scraper | Prices and Store Offers
- Acquire - Acquire Scraper | Startups for Sale & Prices
- Amazon - Amazon Product Scraper
- Amazon Marketplace - Amazon Marketplace Scraper
- AutoScout24 - AutoScout24 Scraper
- eBay Listings - eBay Listings Scraper
- Europages Deep Dive Extractor - Europages Deep Dive Extractor | VAT, Decision Makers, ISO Certs
- Goofish - Goofish Detail Scraper | Listings, Prices and Sellers
- Mafengwo - Mafengwo Scraper | Attractions, Ratings and Tickets
- Vinted - Vinted Scraper
- Walmart - Walmart Product Scraper
💼 Jobs
- ZipRecruiter - ZipRecruiter Jobs Scraper | Salary, Company & Location Filters
- Jobright - Jobright Scraper | Jobs, Salaries and H1B Sponsors
- Multi Board - Multi Board Job Scraper
- Indeed - Indeed Company Reviews Scraper
- Malt Freelancer - Malt Freelancer Scraper
- Glassdoor - Glassdoor Jobs Scraper
- Malt - Malt Scraper | Freelance Profiles
- Glassdoor Job Listings - Glassdoor Job Listings Scraper
- Jora - Jora Jobs Scraper
- LinkedIn Job Search - LinkedIn Job Search Scraper | Salaries & Seniority
- 🔥 Glassdoor - 🔥 Glassdoor Scraper
- ATS - ATS Jobs Scraper | Greenhouse, Lever and Ashby
- Dice - Dice Jobs Scraper | US Tech Jobs, Salaries, Skills
- Dice Tech - Dice Tech Jobs Scraper
- Francetravail - Francetravail Scraper | Job Offers and Salaries
- Freelancermap - Freelancermap Scraper | Projects, Skills and Companies
- Gupy - Gupy Jobs Scraper | Brazil Jobs and Employers
- iimjobs - iimjobs Jobs Scraper | MBA, Finance and Hirist Tech Jobs
- Instahyre - Instahyre Jobs Scraper | Companies, Recruiters and Ratings
- Jora - Jora Scraper | Jobs in Australia, New Zealand, Singapore
- StepStone - StepStone Scraper
- Welcome to the Jungle - Welcome to the Jungle Job Scraper
- YCombinator - YCombinator Jobs Scraper | Startup Jobs, Salaries and Founders
- Zhaopin - Zhaopin Scraper | Jobs, Salaries and Companies
- All - All Jobs Scraper
- Arbeitsagentur - Arbeitsagentur Scraper | German and Austrian Job Board
- Arbeitsagentur - Arbeitsagentur Jobs Scraper
- Cutshort - Cutshort Jobs Scraper | Salaries, Skills and Companies
- iimjobs - iimjobs Scraper | Jobs, Companies and Recruiters
- Indeed - Indeed Companies Scraper | Reviews, Salaries, Interviews
- Indeed - Indeed Jobs Scraper | NLP Skills
- Indeed - Indeed Jobs Scraper | Job Listings in 73 Countries
- LinkedIn - LinkedIn Jobs Scraper
- Naukri & NaukriGulf - Naukri & NaukriGulf Jobs Scraper
- Seek - Seek Job Scraper
- Welcome to the Jungle - Welcome to the Jungle Scraper | Jobs and Company Data
- Ziprecruiter - Ziprecruiter Scraper
🏠 Real estate
- SeLoger - SeLoger Scraper | Real Estate Listings
- Realtor Rental Listings - Realtor Rental Listings Scraper
- Airbnb Professional Host - Airbnb Professional Host Scraper | Emails, Phones, SIRET
- Airbnb Pro Host Contact & - Airbnb Pro Host Contact & Email Scraper
- Bien'ici - Bien'ici Scraper | Property Listings
- Idealista - Idealista Scraper
- SeLoger - SeLoger Scraper | French Property Listings and Agencies
- Realestate.com.au - Realestate.com.au Scraper
- Rightmove - Rightmove Scraper
- Trulia Rental Listings - Trulia Rental Listings Scraper
- Bienici - Bienici Scraper
- Domclick - Domclick Scraper | Real Estate Listings
- OpenRent - OpenRent Scraper | Rental Listings and Landlords
- Realtor - Realtor Detail Scraper | Property Details and Price History
- Zapimoveis - Zapimoveis Scraper | Real Estate Listings and Prices
- Zillow - Zillow Scraper
- Airbnb Search - Airbnb Search Scraper | Prices, Fees, Amenities, Hosts
- Airbnb Search - Airbnb Search Scraper
- Anjuke - Anjuke Scraper | Rental Listings, Prices and Agents
- Idealista - Idealista Scraper
- Realtor Rental - Realtor Rental Scraper
- Trulia Rental - Trulia Rental Scraper | US Rentals, Prices, Pet Policy
📣 Social media
- LinkedIn Post Search - LinkedIn Post Search Scraper | Keywords, Hashtags & Profiles
- Facebook Search - Facebook Search Scraper
- Instagram - Instagram Story Scraper | Stories & Highlights
- Facebook Search - Facebook Search Profiles Scraper | People by Name or Keyword
- LinkedIn Leads - LinkedIn Leads Scraper | Sales Navigator Export
- TikTok Creative - TikTok Creative Ads Scraper | Top Ads, Landing Pages & Metrics
- TikTok Trend - TikTok Trend Scraper | Trending Hashtags and Videos
- YouTube - YouTube Channel Scraper | Videos, Shorts and Views
- Reddit - Reddit Scraper | Posts, Comments and Subreddits
- TikTok - TikTok Scraper
- LinkedIn Hashtag & - LinkedIn Hashtag & Post Scraper | No Cookies
- LinkedIn Sales Navigator - LinkedIn Sales Navigator Scraper
- Pinterest - Pinterest Ads Scraper | Ad Library, Reach & Targeting
- Snapchat - Snapchat Videos Scraper | Spotlight Videos, MP4 and Stats
- Discord - Discord Profiles Scraper | Users, Badges and Server Tags
- Discord - Discord Scraper | Servers, Member Counts and Invites
- Douyin - Douyin Transcript Scraper | Subtitles and Speech to Text
- Kwai - Kwai Scraper | Videos, Creators and Hashtags
- Likee - Likee Scraper | Videos, Hashtags and Creators
- LinkedIn Event - LinkedIn Event Scraper
- LinkedIn People Search - LinkedIn People Search Scraper | Profiles & Companies
- Meta Ad Library - Meta Ad Library Scraper
- Snapchat - Snapchat Contacts Scraper | Phones, Emails and Websites
- TwitchTracker - TwitchTracker Scraper | Twitch Streamer Stats and Rankings
- Bandsintown - Bandsintown Scraper | Concerts and Tour Dates
- Bilibili - Bilibili Scraper | Videos, Profiles, Comments, Danmaku
- Facebook Business Page - Facebook Business Page Scraper
- Facebook Thread - Facebook Thread Profiles Scraper | Followers, Bios & Engagement
- Instagram Engagement - Instagram Engagement Scraper
- Kuaishou - Kuaishou Scraper | Videos, Comments and Creator Stats
- LinkedIn Ads Library - No Cookies - LinkedIn Ads Library Scraper - No Cookies
- OnlyFans - OnlyFans Profiles Scraper | Creator Prices, Stats & Links
- OnlyFans - OnlyFans Profile Scraper
- Pinterest - Pinterest Profiles Scraper | Followers, Emails and Bios
- Pinterest - Pinterest Videos Scraper | Video Downloader, MP4 Links, Stats
- Reddit - Reddit Comments Scraper | Search, Threads and Replies
- Reddit - Reddit Profiles Scraper | User Karma, Activity and Communities
- RedNote - RedNote Videos Scraper | Downloader, Transcripts and Stats
- TikTok Lookalike - TikTok Lookalike Scraper | Influencers, Emails and Engagement
- YouTube Autocomplete - YouTube Autocomplete Scraper | Keyword Suggestions
- Douyin - Douyin Comments Scraper | Comments, Likes and IP Regions
- Facebook - Facebook Company Scraper | Emails, Phones, Ratings
- OnlyFans - OnlyFans Creator Scraper
- Reddit - Reddit Scraper | Comments, Posts and Users
- RedNote - RedNote Detail Scraper | Xiaohongshu Details, Images, Videos
- Skool Group - Skool Group Scraper
- Skool Community - Skool Community Scraper
- Snapchat - Snapchat Ads Scraper | Ad Library, Impressions & Targeting
- Weibo - Weibo Scraper | Posts, Profiles and Engagement
- X Timeline - X Timeline Scraper | Tweets and Engagement Stats
- Xigua - Xigua Scraper | Videos, Creators and Downloads
- YouTube - YouTube Transcript Scraper
🏢 Business data
- LinkedIn Company Search - LinkedIn Company Search Scraper | Profiles & Firmographics
- Teachable Course - Teachable Course Scraper
- Website Tech Stack - Website Tech Stack Scraper
- Teachable - Courses, Prices & Instructors - Teachable Scraper - Courses, Prices & Instructors
- Trustpilot - Trustpilot Scraper | Reviews, Ratings and Company Contacts
✈️ Travel
- Tencent - Tencent Scraper | Maps Places, Phones and Ratings
- Flight Price - Flight Price Scraper
- Zomato - Zomato Reviews Scraper | Restaurant Ratings and Replies
- 2GIS - 2GIS Reviews Scraper | Ratings, Photos and Owner Replies
- Apple Maps - Apple Maps Scraper | Places, Phones and Emails
- Booking.com Hotel - Booking.com Hotel Scraper
- Despegar - Despegar Reviews Scraper | Hotel Reviews and Ratings
- Google Maps - Google Maps Scraper
- Kakao - Kakao Scraper | Map Places, Reviews and Phones
- OpenTable - OpenTable Reviews Scraper | Restaurant Reviews and Ratings
- TheFork - TheFork Scraper | Restaurants, Menus and Ratings
- Trip - Trip Reviews Scraper | Hotel Reviews and Ratings
- Viator - Viator Reviews Scraper | Tour Reviews and Ratings
- Booking - Booking Scraper | Hotel Prices, Photos, Availability
🎯 Lead generation
- Northdata - Northdata Company Scraper
- Dealroom - Dealroom Scraper | Companies and Investors
- ZocDoc - ZocDoc Scraper | Doctors, Reviews and Availability
- PagesJaunes - PagesJaunes Scraper | French Business Emails and SIRET
- Similarweb - Similarweb Scraper | Website Traffic, Rankings and Competitors
- BuiltWith - BuiltWith Scraper | Tech Stacks and Top Sites
- SIRET - SIRET Company Enricher
- UK Companies House - UK Companies House Enricher
- Justdial - Justdial Companies Scraper | Business Leads, Phones and Emails
- PagesJaunes - PagesJaunes Business Scraper
- ThomasNet Suppliers - ThomasNet Suppliers Scraper
- CNPJ Brazilian - CNPJ Brazilian Company Enricher
- Company Data - Company Data Scraper | Emails, Phones and Tech Stack
- CSLB - CSLB Scraper | Contractor Licenses, Bonds and Leads
- Dealroom Startup Data - Dealroom Startup Data Scraper
- Delaware - Delaware Scraper | Corporations, LLCs and Registered Agents
- French Company Prospector - French Company Prospector
- G2 - G2 Reviews Scraper
- Pappers - Pappers Scraper | French Companies, Directors & Financials
- SEC - SEC Scraper | EDGAR Filings and Company Data
- SoftwareAdvice - SoftwareAdvice Scraper | Reviews, Ratings and Pros & Cons
- Sunbiz - Sunbiz Companies Scraper | New Florida Business Leads
- Sunbiz - Sunbiz Scraper | Florida Companies and Officers
- USPTO - USPTO Scraper | Trademark Search and Status
- Clutch - Clutch Scraper | Agencies, Reviews, Ratings, Services
- Clutch Agency - Clutch Agency Scraper
- Domain - Domain Enricher
- Google Ads Transparency - Google Ads Transparency Scraper
- KVK - KVK Scraper | Dutch Companies and SBI Codes
- Paginasamarillas - Paginasamarillas Scraper | Business Leads, Emails and Phones
- SIRET French - SIRET French Company Enricher
- ZocDoc - ZocDoc Scraper
🔎 SEO
- Scribd - Scribd Scraper | Documents, Authors and Views
- SpyFu - SpyFu Scraper | SEO, PPC and Competitor Data
- Apple - Apple Reviews Scraper | App Store Reviews and Ratings
- Apple - Apple Scraper | App Store Apps, Ratings and Charts
- Bing - Bing Enricher Scraper | Mobile Friendly Test and Indexing
- Google News - Google News Scraper
- Yandexsearch - Yandexsearch Scraper | Search Results and Rankings
🎬 Video
📰 News
- ForexFactory - ForexFactory Scraper | Economic Calendar and Forecasts
- FT - FT Scraper | Financial Times Articles, Authors and Topics
- OpenAI - OpenAI Scraper | News, Blog Posts and Research
🧰 More tools
- PrizePicks - PrizePicks Scraper | Player Props, Lines and Projections
- Equibase - Equibase Scraper | Horse Racing Entries and Results
- FanDuel - FanDuel Scraper | Odds, Spreads and Player Props
- Maersk - Maersk Scraper | Vessel Schedules and Port Calls
Support
Need something this scraper doesn't do yet? We ship features fast.
- Feature requests go straight to our backlog
- Enterprise needs? We do custom integrations and high-volume plans
- Pricing questions? Check the Monetization tab on the actor page
Response time: usually under 24 hours.
Legal compliance
This Actor extracts publicly available data from screener.in. It does not bypass any login, paywall or CAPTCHA. Users are responsible for complying with screener.in's terms of service and applicable data protection laws (GDPR, CCPA, and PIPL where relevant). The output describes listed companies and their public filings; it holds no personal data beyond what companies publish about themselves. The data returned is informational and is not investment advice; verify it against the exchange filings before any regulated use.
Built for equity analysts, quant researchers, fintech builders and financial writers who need screener.in's fundamentals as data, not as tabs.


